We will now enter demand data for the model.
Market Segment demand data
- Right-click on the Market Segment icon Households. The pop-up menu for a Market Segment appears.
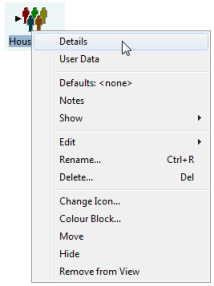
Figure 1: Accessing the Details dialog for a market segment
-
Select Details. The Market Segment Details dialog appears. Select the Size field and left-click on the small button that appears to the right to access the Size time-series dialog (alternatively, right-click on the Size field and select Details from the local context menu).
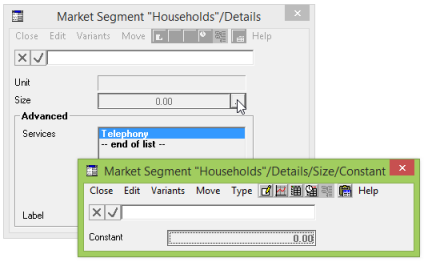
Figure 2: Accessing the Size time-series dialog for a market segment
- The default data input type is a Constant, but in the POTS model we use a different type (an Interpolated Series) to show how demand develops over the duration of the model. (For more details of the different types of time series that are available within STEM, see 10.3.33 Time-series inputs.)
- From the Type menu, select Interpolated Series. This displays an Interpolated Series dialog as shown in Figure 3 with rows for pairs of Periods and Values respectively. The cell for the first year is highlighted.
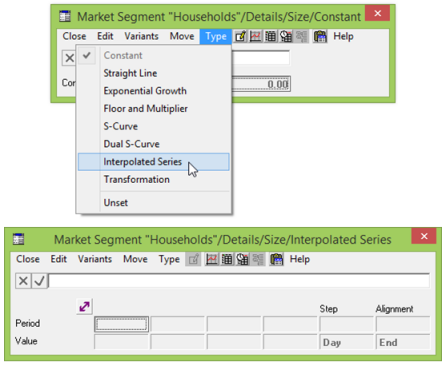
Figure 3: Changing Type in the Market Segment Size time-series dialog
-
Enter the data as set out below. This represents the number of households which could be the market for the service over the period of the model run. In effect this is ‘the number of houses passed’.
| Period
|
2000 |
2001
|
2002
|
2020
|
|
Value
|
0
|
10000 |
20000 |
100000 |
- Enter 2000 in the highlighted Period cell and then press the <return> key.
- Tab or use the arrow keys to highlight the next cell and enter 2001.
- Continue until you have entered all the Periods as above.
- Select the first Value cell and enter 0 for the year 2000.
- Continue tabbing and entering data until you have entered the figure for 2020.
- The Interpolated Series should now look as in Figure 4 below.
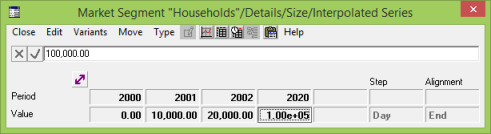
Figure 4: Completed Interpolated Series for Demand
Note: You need to enter a zero value for 2000. If you do not, STEM will assume a demand of 10000 connections in 2000. STEM interpolates the values for the years between 2002 and 2020.
Note: In any Interpolated Series, if, for example, the first value you enter is for Year 5, STEM assumes that values for previous years (0, 1, 2, 3, 4) will be the same as that for Year 5. Similarly, if you enter values for Years 6 and 7 but no other value after that, STEM assumes that values after Year 7 are the same as that in Year 7.
Service Demand data
Demand data for a Service is entered in the Service Demand dialog. Demand for a Service can be dimensioned in three ways:
-
Connections
-
Traffic
-
Busy Hour Traffic.
For details of specifying demand, see 10.3.8 Demand.
In the POTS model, we are dimensioning demand in terms of connections from the Market Segment Households. The number of connections is given by the size of the Market Segment and the penetration of the Service into that segment.
- Double-click on the Service icon Telephony. The pop-up menu for a Service appears.
- Select Demand.
- The Service Demand dialog appears.
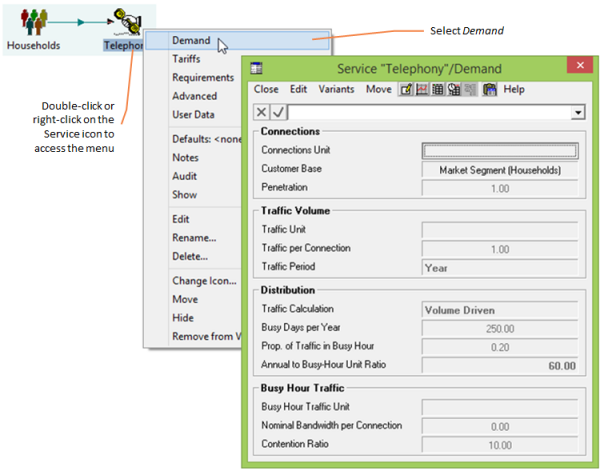
Figure 5: The Service icon menu and Demand dialog
The Connections Unit field in the Demand dialog is simply a label which has no influence on the model but does appear on Results graphs. You can select a label from the ones available in the list box or you can type in a label of your own.
-
Select the Connections Unit field by clicking on it. Note that a drop-down arrow button appears to the right of the formula bar.
- Click on the arrow button to reveal the available labels.
- Select Connections.
-
Press <Enter> or click on the
 button to confirm your choice.
- Alternatively type a new label and press <Enter>.
Note: You can see that the Customer Base field in the Demand dialog says ‘Market Segment (Households)’, because the Service Telephony was automatically linked to the Market Segment when it was created.
Penetration
The other field in the Connections group is the Penetration. By default, this is set to Constant {1.0}, representing 100%. For the POTS model we will leave it as it is. In other words, the entire addressable market has indeed been addressed, i.e., the number of connections is the same as the size of the market segment.
Traffic Volume and Distribution
As well as the number of connections in the model, we also need to define the traffic that each of these connections generates.
-
Type Call Minutes as the unit of traffic or select it from the drop-down list box.
-
Left-click on the Traffic Per Connection button to select the field.
- Enter 7500 as a Constant (which can be typed directly onto the button).
-
Press <Enter> or click on the button to confirm your choice.
- This figure is made up on the basis that:
- each connection generates 30 minutes of calls per day
- usage days are 250
-
Annual Average traffic = 250 × 30 minutes = 7500 which is not predicted to change over the course of the model.
Distribution
For the purposes of the POTS model, we will accept the default values for Distribution, namely that there are 250 busy hours per year and that 20% of traffic occurs in the Busy Hour.
For further details of demand see 10.3.8 Demand.