We are now going to look at the effect of introducing new technology to satisfy the demand for telephony in the POTS model. From 2005, digital switches will be used to satisfy incremental demand and to replace the analogue switches that come to the end of their physical lifetime. We will use the same demand as in the original POTS model.
The new digital switch has exactly the same capacity and cost characteristics as the analogue switches. Since their costs are identical, the only effect on the model results will be in the demand for each type of switch after 2005.
- Sketch what you expect demand for each Resource to be, both the incremental demand (that is new demand in each year) and the installed connections (that is the total number of switches of each type in use at any time).
Copying Elements
In order to study the effects of this change-over, we need to create a new Resource element for the digital switch. We will use one of the copy-and-paste features of STEM to do this.
- Load the POTS model into the editor and save it as POTS_2.
- Select the Resource element icon Analogue Local Exchange.
- Select Copy from the Edit menu.
- This copies the element icon together with all its data.
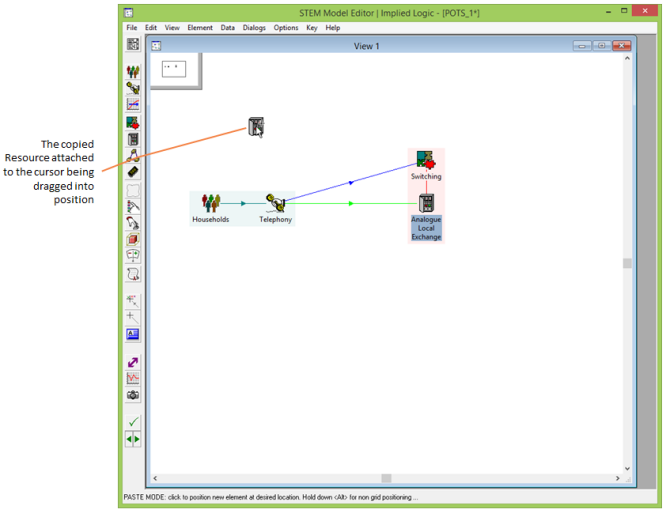
Figure 1: A copied Resource ready for placing
- Select Paste Elements. A new Resource element is created, attached to the cursor. A message appears in the menu bar: “PASTE MODE: click to position new element at desired location. Hold down <Alt> for non grid positioning…”.
- Move the new element to where you want to position it and either click on the mouse or press Enter. The new element (named Analogue Local Exchange 1, if you have Automatic Names checked) is created with the same data and dependencies as the original Resource.
Renaming an Element
When a new element is created, the default behaviour of STEM is to name it automatically. (You can change this default behaviour by unchecking Automatic Names in the Options menu.) When an element is copied, the new element is named according to the element that was copied. To rename the new element:
- Double-click on the new Analogue Local Exchange 1 icon to display the menu (alternatively, press <F2> to access the Rename Element dialog directly).
- Select the Rename command.
- Type in Digital Local Exchange and click OK.
Comparing Element data
You can verify that the two Resources really do have the same data characteristics:
- Click on the first Resource to select it.
- Hold down the <Shift> key and click on the second Resource to extend the selection.
- Right-click on the second Resource to display the icon menu.
- Select Costs.
A tabular dialog is displayed, showing the data for the two Resources side-by-side in two columns.
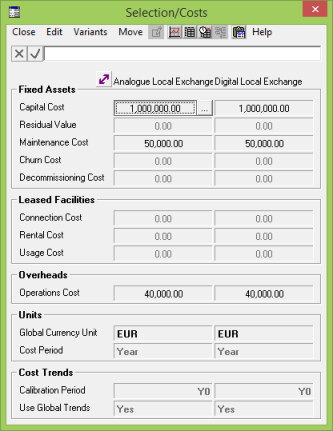
Figure 2: Tabular Costs dialog
See 4.5.6 Accessing tabular dialogs for more information on tabular dialogs.
Switching from one Resource to another
The implementation of the change-over from one technology to another is achieved by altering the respective Requirements. This is most easily effected in the Mappings dialog, accessed by double-clicking on the line that connects the Service to the Function (in this case, the blue line between the Service icon and Local Switching Function icon).
- Double-click on the line between the Telephony Service and the Local Switching Function icons to open the Mappings dialog, which shows the mappings for both Resources as time series.
- Select the 2003 value for Analogue Local Exchange. Type 1 and press <Shift+ Enter>. Use of the shift key instructs STEM to define this input as an interpolated series with the specific value of 1.0 in 2003.
- Select the 2004 value and type 0 and press <Enter>. By default, the Editor prompts to adjust the surrounding calculated values.
- Select Yes to adjust the following values to 0 as well. (The preceding value for 2003 is already fixed at 1.0.)
- Select the 2003 value for Digital Local Exchange. Type 0 and press <Shift+ Enter>.
- Select the 2004 value and type 1 and press <Enter>. Select Yes to adjust the following cells to 1 as well.
- Close the dialog and select Save and Run from the File menu (or press <F5>).
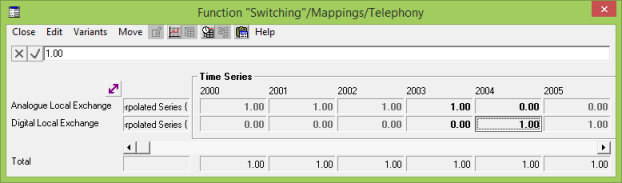
Figure 3: Mappings dialog showing technology changeover
Now let’s look at the graphs for Resource Installed & Incremental Units and see whether they agree with your predictions. Select Draw from the Graphs menu.
- Select Resource Installed & Incremental Units. The Choose Elements to Draw dialog is displayed.
- The Choose Model dialog opens if any other models are open.
- Click on the Set All button to select the results for both Resources. (Note that there is also an option to draw both results on one graph.) The two graphs are drawn.
- Select Tile from the Graphs menu to be able to see both results at the same time.
Can you explain these results? Are they as you predicted?