STEM results can be viewed as graphs, or tables which can be used as input to another program. The user has considerable flexibility in defining the way the data is presented.
Figure 1
and Figure 2
show a typical result presented in two different graph formats.
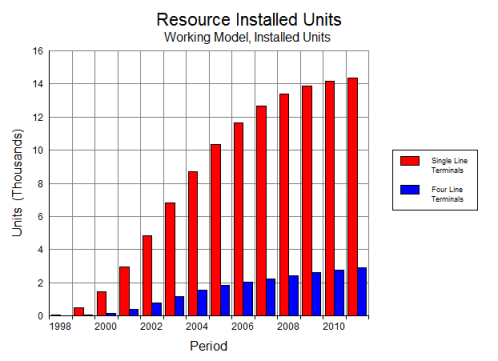
Figure 1: A typical STEM result as a bar graph
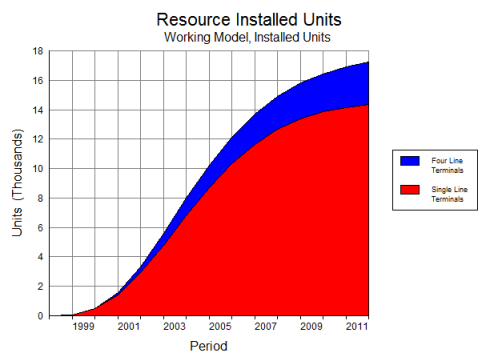
Figure 2: A typical STEM result as an area graph
Figure 3 shows the graph in
Figure 2 as a table.
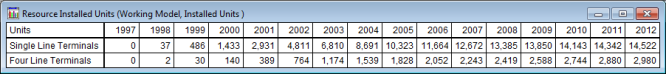
Figure 3: A typical STEM result in table format
The following gives an indication of the range of results possible:
-
Network Results
– revenue, capital expenditure, depreciation, amortisation, operating costs, operating profit, cashflow from operations, interest, tax, net profit, capital employed, NPV, IRR
-
Service Results
– demand, tariffs, revenue, allocated depreciation, allocated operating costs, operating profit, capital employed
-
Function and Resource Results
– installed capacity, utilisation, incremental units, capital expenditure, depreciation, amortisation, operating costs.