An equivalent function in the Results Program enables you to add charts and tables to a web presentation in a very similar manner to exporting results to Excel:
-
Select Create Web Interface… from the File menu. The Create Web Interface dialog is displayed.
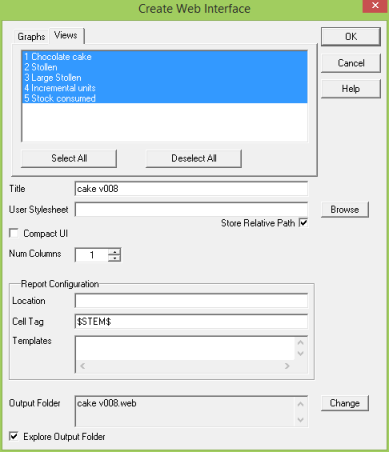
Figure 1: The Create Web Interface dialog
-
Enter a Title for your web presentation (if the model filename is not suitable). If you have previously exported from the Editor then the title used in your previous export should be picked up automatically.
- Pick the charts and tables you wish to add:
- select individual charts and tables from the current view, or
- click the Views tab and make a selection of separate results views
- Review the Compact UI setting. If you have previously exported from the Editor then the selection you chose there should have been remembered.
- If you wish to present results charts in multiple columns then select the number of columns here. If you are using the default exported page template rather than fitting the web interface into your own page template we recommend sticking to the default setting of a single column.
- Review the Report Configuration. If you have previously exported from the Editor then the values for report generation should have been taken from that export automatically.
- Review the Output Folder. If necessary, click the Change button to alter it.
- Check or uncheck Explore Output Folder and then press OK. The Results Program creates or updates the relevant files and then optionally opens Windows Explorer in the output folder.
If you choose to include multiple views, then the generated web interface will present the respective charts and tables in separate tabs. Since an initial number is typically used to control the sorting of views in the Results Program, the creation process presents the tabs in the same order and then suppresses the numbers from the tab labels.
The order of charts and tables within an individual tab or non-tabbed interface currently depends on the order in which the charts and tables were first created. Further control may be provided in a future update.