Cost allocation is implemented across the same calculation framework for demand which is generated at run-time. Shares of Resource costs are routed to the respective Services responsible for used and slack capacity. STEM incorporates an efficient mechanism for preserving the separation of allocated costs from different Resources and is able to deliver allocated cost results for Services broken down by individual contributing Resources.
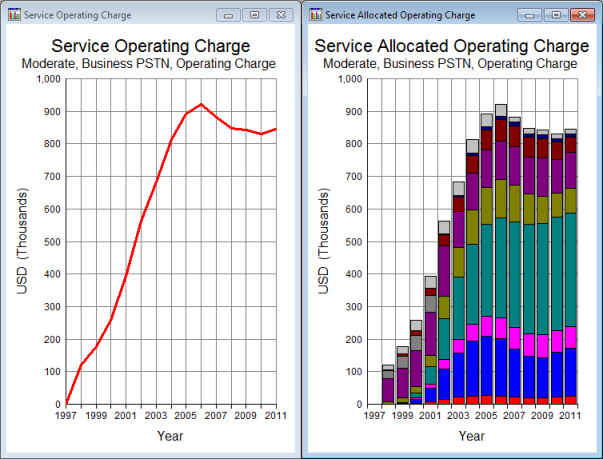
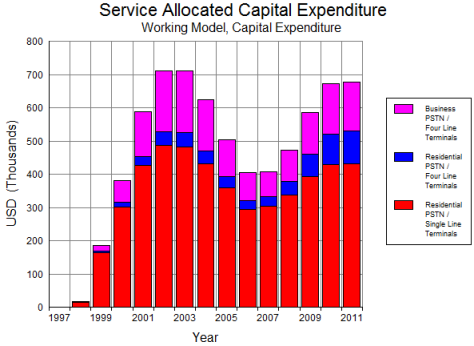
Figure 1: Operating charge broken down by contributing Resources
This breakdown of allocated costs by individual originating Resources provides unprecedented insight into the economics of service provision, highlighting areas where cost reductions would be most effective. New graph definitions allow cost-breakdowns such as Service Allocated Operating Charge to be drawn directly from the Graphs menu. Now you can explore all the usual cost results for individual Service/Resource combinations. The available combinations are determined by the actual links in the model, which define a sparse sub-set of all possible combinations.
The new Allocated Used Capacity result can be used to understand respective Service shares of the installed capacity of a Resource. Care must be taken when comparing results for different Resources, because they may have quite different capacity units.
You can also draw allocated costs for Transformations broken down by contributing Resource.
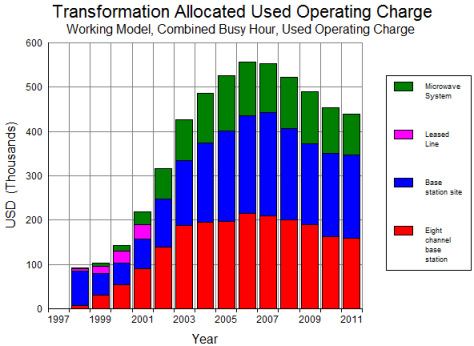
Figure 2: Transformation costs from various Resources
The model engine only generates allocated results for Resources which actually contribute costs to a given Service. An efficient algorithm allows these separate Resource costs to be passed through intermediate Transformations without a massive increase in computation. Although disk space is no longer a major constraint, this output is optional. In order to avoid the performance overhead, set Cost Breakdown = None
in the global Other Details dialog.
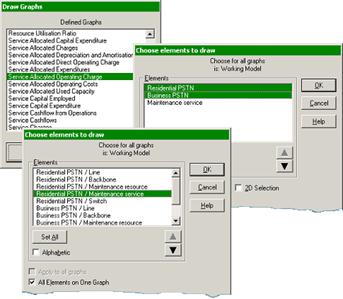
Drawing a cost-breakdown graph
-
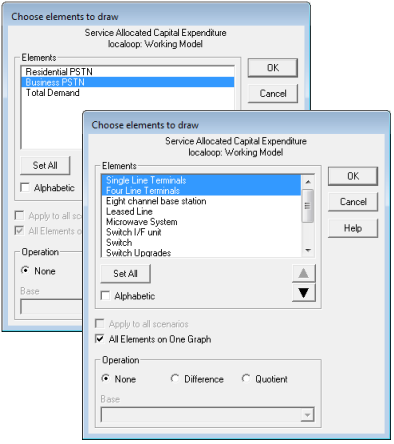
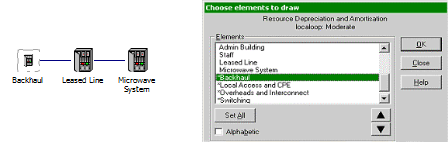
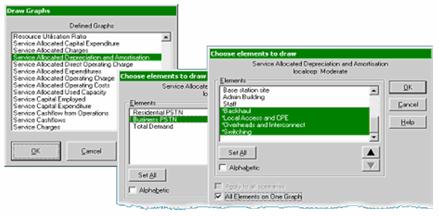
Select one of the new Service Allocated graphs to draw, such as Service Allocated Capital Expenditure. The Choose Elements to Draw dialog is displayed listing all the Services.
-
Select the desired Service(s) from the list. The Choose Elements to Draw dialog is displayed listing all the Resources that contribute to the selected Service.
-
Select the desired Resources (or click on Set All) and make sure All Elements on One Graph is checked. Click OK to draw the graph.
If you want to draw a graph for more than one Service, this brings in a new choice regarding the Resources that are included. Normally one would first choose the Services and then the dependent Resources, to draw, for example:
{Service 2, Service 3} × {Resource 5, Resource 6}
But suppose you specifically want to draw, say, only three of the four possible results from this combination of Services and Resources? Proceed as follows:
- Select the type of graph to draw.
- Select the desired Services from the list.
-
Deselect the 2D Selection check box to make a ‘linear’ selection of individual Service/Resource combinations.
- Select the desired Service/Resource combinations and check All Elements on One Graph.
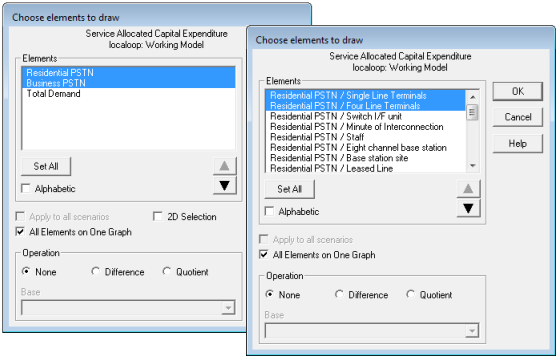
- Click OK to draw the graph.
Intermediate Services for separate network and business layers
You can choose to allow a Service to allocate costs to a driving Resource, and thus back to primary services. By replacing an intermediate Transformation, such a Service captures both used and slack costs in order to generate fully-allocated intermediate costs. In order to achieve this, you must set Value Chain =
Cross Charge
in the Other Details dialog of the Service, and ensure that it is driven by a Transformation whose type is set to Resource.
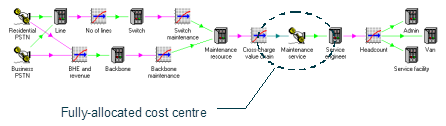
Figure 3: Using a Service to generate fully allocated intermediate costs
Secondary costs are identified with a single primary cost item as an internal cross-charge. This must be balanced with an internal revenue charge to avoid double-counting at the network level. Contrast this approach with the value-chain feature in STEM, which models the resale of an external commodity, mapping secondary revenues onto primary costs.
The scope of separately allocated cost breakdown can be limited to a single layer by setting Cost Breakdown = Opaque
in the global Other Details dialog. In this mode, an intermediate Service presents a sub-total of all costs allocated from secondary layers. By default, with Cost Breakdown =
Transparent, allocated costs from all linked Resources are reported at the top level.
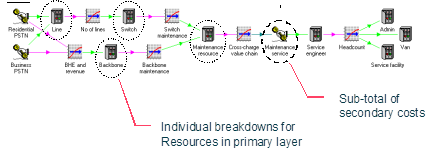
Figure 4: Limiting the scope of cost breakdown
In multi-layer cost-breakdown graphs, the choice of ‘elements’ to draw is again made in two stages, first from all Services, and then from the Resources which contribute to the selected Services – plus dependent intermediate Services.
Note: Results for dependent intermediate Services can currently only be displayed with a linear (non-2D) selection.
Aggregating results using Collections of Resources
Collections can be used to provide automatic sub-total results for arbitrary groups of elements. The names of Collections of Resources are shown with an asterisk in the list of Resources when choosing elements to draw for a graph. These same Collections can be used to provide sub-totals of per-Resource allocated Service costs.
Using the Excel add-in with the new types of results
The StemGetResult() worksheet function will understand the following labels:
- Business PSTN/Leased Line (Service × Resource)
- Residential PSTN/Backhaul (Service × Collection)
- PSTN/Leased Line (Collection × Resource)
- PSTN/Backhaul (Collection × Collection).
In addition, the usual add-in toolbar buttons can be used to enumerate the defined results of type Service/Resource and Transformation/Resource, as well as the available element combinations.