At the core of any company’s annual report are the financial statements. The main elements are the profit and loss and cashflow statements, and the balance sheet.
The profit and loss statement shows, from the point of view of the shareholders, the result of the year’s activity with a focus on the year’s performance, i.e., profit for the year – see Figure 1 below.
The cashflow statement shows how the funds generated by the business have been used over the year: to purchase capital assets (Capital Expenditure), cover Operating Costs, e.g., salaries, re-pay creditors (additions to Working Capital), pay interest (Net Interest Expense) and tax (Tax Owing)
– see Figure 2 below.
The balance sheet gives a picture of the business at a particular point in time (usually as of 31 December of the year). It presents the assets, liabilities (borrowings) and shareholders’ funds of the company according to the standards of double-entry book keeping. This means that the balance sheet has to balance total assets compared with total liabilities plus equity – see Figure 3 below.
The essential difference between the profit and loss and the cashflow is that the former deals with
charges
incurred during one year, whereas the latter shows expenditures,
i.e., real money spent over the same period. Charges and expenditures
are related through depreciation of capitalised assets, such as fixed assets. The idea is to spread the cost of major acquisitions of fixed assets over a depreciation period, and present the profit for the year on the basis of these
charges, rather than the corresponding expenditures, so as to smooth out the impact of major expenses.
These three statements are included as output tables –
prof.xls,
cash.xls
and
bala.xls
– in the standard results configuration,
default.cnf.
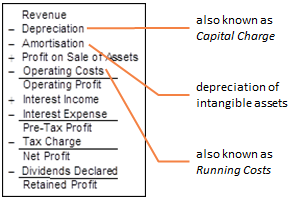
Figure 1: The profit and loss statement
The structure of the profit and loss and cashflow are very similar. Whereas Depreciation and Amortisation are shown on the profit and loss, i.e., charges incurred during one year, the equivalent in the cashflow is Capital Expenditure, i.e., money spent on capital assets in the year.
Operating Costs include all Service and Resource current expenditures: respectively Administration and Provision Costs, Maintenance, Churn, Connection, Rental, Usage, Operations and Decommissioning Costs.
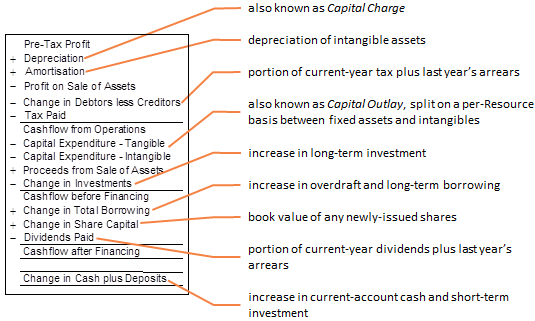
Figure 2: The cashflow statement
Change in Debtors less Creditors represents the difference between the increase in Debtors and Creditors during the year. A positive difference means that money owed by Debtors has grown faster than the money owed to Creditors. This is regarded as an expenditure in the cashflow, as are Operating Costs and Capital Expenditure.
Interest is calculated on average balances over the year, and tax is calculated on the Pre-Tax Profit – see 10.3.11 Financial charges: interest, tax and dividends.
The balance sheet is the centrepiece of the financial model in STEM. It is presented here and in
default.cnf as total assets compared with total liabilities plus equity, but there are several other popular layouts, e.g., long-term assets plus working capital compared with long-term borrowing plus equity. It is a simple matter to change the order of these results in the output tables.
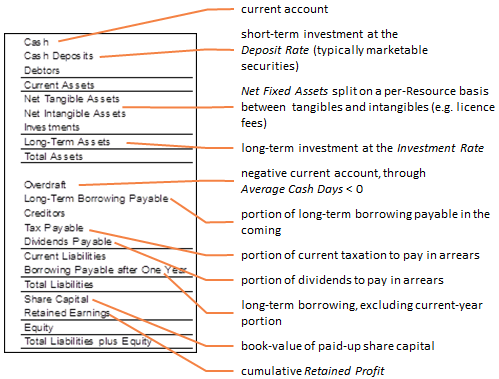
Figure 3: The Balance Sheet
The depreciated value of capital assets, or net fixed value of assets, is represented by the Net Tangible Assets and Net Intangible Assets results, collectively known as Net Fixed Assets.