The standard financial measure of a project’s performance is the Net Present Value (NPV) of future cashflows over a specific period, such as ten years, for a given discount rate. STEM allows you to compute this, not only for a fixed period, but for any period up to the end of the model run. This more general Discounted Cash Flow (DCF) analysis enhances understanding of the financial flows associated with each scenario and allows you to compute measures such as the discounted pay-back period.
Figure 1
below compares the NPV for the three scenarios of a sample model at a discount rate of 10%. It shows that, for this particular set of assumptions, the shortening of a roll-out period from ten to five years has a significant impact on the NPV after 15 years. Furthermore, the
Moderate roll-out scenario reduces the discounted pay-back period by one year compared with the
Slow scenario, but requires a peak borrowing 40% higher than the Slow scenario in 2002.
As the Fast scenario shows, a further decrease in the roll-out length increases the borrowing requirements, but the extra revenue generated does not reduce the pay-back period any further or give a higher terminal NPV than the
Moderate scenario. Thus the Moderate scenario appears to be the optimal roll-out strategy, with the shortest pay-back period and the highest terminal NPV.
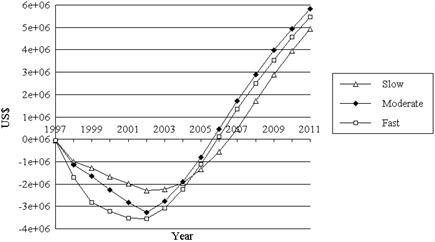
Figure 1: Network Net Present Value
This conclusion can be reinforced by comparing the Internal Rate of Return (IRR) for these three scenarios – the constant discount rate which would give a zero NPV in a given year.
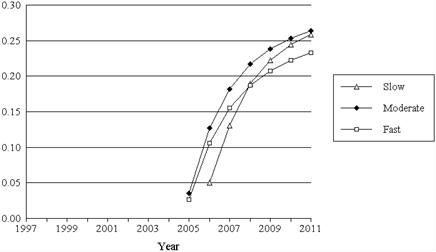
Figure 2: Network Internal Rate of Return
As you can see from Figure 2 above, the
Moderate scenario consistently out-performs both the other scenarios. (The IRR result is unavailable before 2005 because the nominal (undiscounted) cashflow does not pay back until this point, and not until 2006 in the
Slow scenario.)