The STEM Editor allows you to construct and explore a picture of the telecoms network or fragment that you want to model. Each element within the model – e.g., service demand and the resources to satisfy that demand – is created from the toolbar and then represented as an icon in a view window.
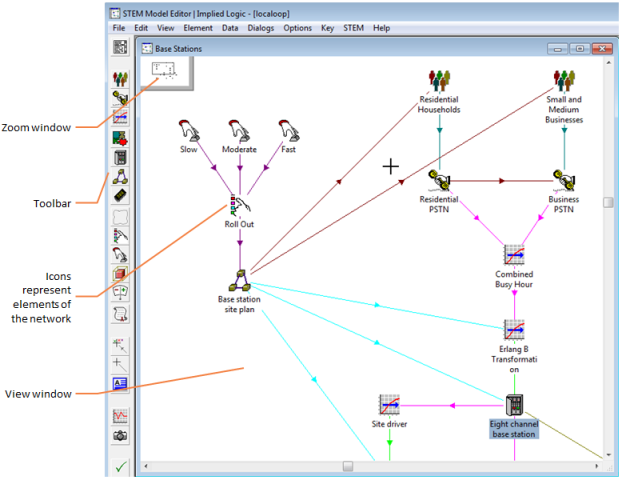
Figure 1: The STEM Model Editor
Each element has a number of associated dialogs, accessed from a pop-up menu on the icon, which allow you to enter and review data for that element. Dialogs for data which affects the whole model (global data) are accessed from the main Data menu or from a pop-up menu on the view window. From this information, the demand, installed capacities, costs, revenues and other financial results associated with the model are calculated for each year or period of the model run.
Relationships and dependencies between model elements can be defined directly by dragging between the corresponding icons. These links are then indicated by different coloured lines between the icons. In addition to these automatic links, you can add manual links to illustrate relationships outside the model.
The extent of a view is not limited by the size of the actual view window. In order to access elements which lie outside the current window:
- use the scroll bars at the right and bottom of the view window, or
-
click and drag the rectangle within the zoom window, which represents the position of the visible window relative to the full extent of the view.
Viewing the data associated with elements
Each element in the model is characterised by the associated input data, which is presented in a set of data dialogs. A concise summary of the data set within an element is displayed if you place your mouse cursor over its icon for more than a few seconds.
In order to access one of the data dialogs for an element:
- Double-click or right-click on the icon representing the element. A pop-up menu appears.
- Select one of the categories of data in the menu. The corresponding dialog appears.
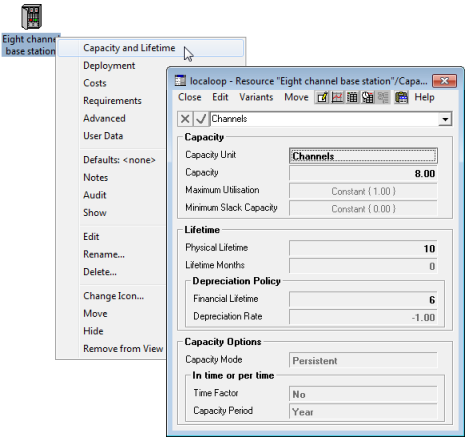
Figure 2: Accessing capacity and lifetime data for a Resource
In Figure 2 the Capacity and Lifetime dialog is displayed for a Resource. The Capacity Unit, Capacity, Lifetime and Depreciation Policy are displayed, and can be modified using the formula bar. The Maximum Utilisation field is a time-series input, a summary of which is displayed on a button. You can click on the button to access the time-series parameters. Select Close from the dialog menu bar to close the dialog.
Dialogs for other elements of the model or other categories of data can be opened using the same procedure. Before proceeding further, we suggest you spend some time browsing through the model data. You can press <F1> in any dialog in order to access the online help for the inputs in that dialog.
The following items provide a brief introduction to a range of factors that a STEM model can take into account.
 Market Segments
Market Segments represent the different groups of customers that may use the Services within the model. Demand for a Service can be represented by the level of penetration of the Service into the size of a Market Segment.
 Services
Services represent the services offered by operators to their customers, such as ISDN, voice mail, X.25 or international calls. The demand for each service is specified in terms of connections, the annual traffic and the busy hour traffic. Tariffs are specified for each Service, which STEM uses to calculate revenues. A Service can have a Connection, Rental and a Usage Tariff. A Churn Tariff can also be specified if required.
 Resources
Resources represent particular types of equipment (e.g., a telephone handset, an ATM switch or a vehicle) or other sources of cost in the network to be modelled.
A Resource is described in terms of its physical characteristics and costs. These include its Physical Lifetime, Capacity, and the various costs of ownership or use (e.g., Capital Cost and Maintenance Cost).
 Transformations
Transformations are used to represent special relationships between calculated quantities in the model. They can, for example, be used to relate the required capacity of one Resource to the installed capacity of another, potentially in a non-linear way. They can also be used to relate the use of a Service to the installed capacity of a Resource. Another important type of Transformation is the Erlang B Formula, which is used to convert the busy hour traffic demand of a Service into the Resource capacity which needs to be installed.
Modifying a view
If you wish, you can rearrange the icons in the view window. To move an icon, simply click and drag it with the left mouse button (keep the button pressed until the icon is correctly placed).
Elements can also be temporarily hidden, either individually or as a group, in order to give a clearer view of the model. For example, it is common to hide the Functions associated with Resources. (Functions represent the function that a group of Resources within the model play – a number of different types of Resource might perform the same function within a model, e.g., the
Transmission Facilities
function might be performed by Leased Line or
Microwave System.)
In order to view the Function elements in a view, select Display Options… from the main Element menu. The Display Options dialog appears, as shown in Figure 3.
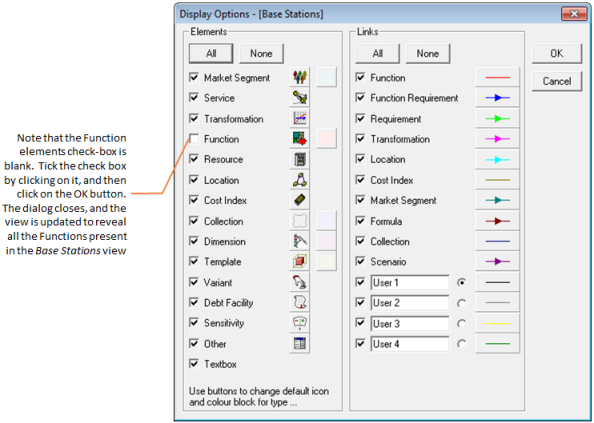
Figure 3: The Display Options dialog
Multiple views
The STEM Editor allows you to create more than one view of a model, each of which can present a different perspective. A model element can be represented as an icon in several views, and each corresponding icon in the respective views provides access to the same model data. Each view provides an interface to the same logical model structure. Although model elements are usually created as icons in a view, individual icons can be hidden, or closed altogether, without deleting the logical elements themselves.
Unhiding other views
When you open a model in the STEM Editor, it automatically displays whichever views were visible when the model was last saved. To show another view of the model:
- Select Editor from the Results program STEM menu to return to the Editor.
-
Select Unhide… from the View menu in the Editor. The Unhide View dialog appears, listing all the hidden views of the model.
-
Select one of these views by clicking on its name in the list, and then click on the OK button. The selected view window is displayed.