The most complex aspect of the model engine’s calculations concerns the allocation of usage, slack capacity and costs when several Services or Transformations share capacity of a number of Resources: how much capacity of each Resource is used by a given Service or Transformation, and how is that usage distributed across different installation ages of the Resource?
Unfortunately, the Results program does not currently have the facility to handle this kind of element–element data; and therefore, two special audits have been added which report:
-
for a Service or Transformation, how much capacity it uses of any Resource
-
for a Resource, how much capacity is used by any Service or Transformation,
with the option in both cases to give a breakdown by Resource installation age.
Auditing Resources used by a Service or Transformation
In order to see which Resources are used by a Service or Transformation:
-
Select Audit from the icon menu for a Service or Transformation. The Audit dialog for the element is displayed.
-
Double-click the Results list in the Audit dialog and then select
*Resources.
-
Select Save and Run from the File menu (or press <F5>). Now when the model runs, an audit will be generated for each period, listing all the Resources used by the Service or Transformation, together with the corresponding used capacity.
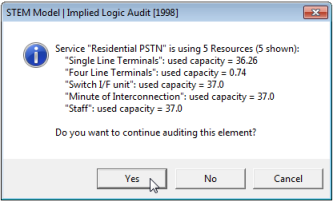
Figure 1: *Resources audit for a Service
Resource installation ages
If you would like to see more detailed information relating to the used capacity of the various installation ages of a given Resource:
-
Select Audit from the icon menu for the Resource. The Audit dialog for the Resource is displayed.
- Set the input Ages = Yes.
-
Select Save and Run from the File menu (or press <F5>). Now when the model runs, per-age data is generated for that Resource (Switch I/F unit in this example).
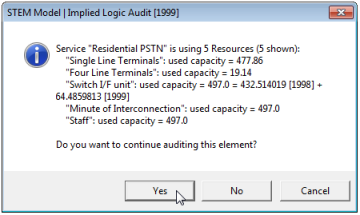
Figure 2: Age information in a *Resources audit
Note: You can copy the Ages input across a tabular Resource Audit dialog in order to generate per-age data for all Resources.
Including certain cross-references in an audit
The *Resources audit for a Service or Transformation reports how many Resources the element is using and, by default, the used capacity for each Resource. In a large model, there may be a large number of cross-references, and it may be helpful to hide some of these in order to focus on a particular Resource or Function.
In order to exclude cross-references to a given Resource:
-
Select Audit from the icon menu for the Resource. The Audit dialog for the Resource is displayed.
- Set the input Include = No.
-
Select Save and Run from the File menu. Now when the model runs, the audit still reports how many Resources are used, but only shows details for a subset of these (4 of 5 in this example).
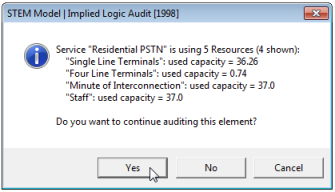
Figure 3: Reduced cross-references in a *Resources audit
Note: Setting the input Include =
No
for an element also suppresses any direct audit output for that element whilst preserving its selection of audit results.
Auditing Services or Transformations using a Resource
In order to see which Services or Transformations are using a Resource:
-
Select Audit from the icon menu for a Resource. The Audit dialog for the Resource is displayed.
-
Double-click the Results list in the Audit dialog and then select
*Services
or *Transformations (or just *Demands
– all three are equivalent).
-
Select Save and Run from the File menu (or press <F5>). Now when the model runs, an audit will be generated for each period, listing all the Services and Transformations using the Resource, together with the corresponding used capacity.
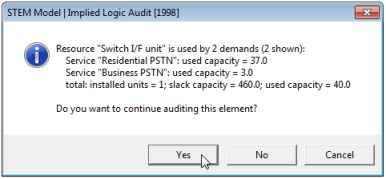
Figure 4: *Demands audit for a Resource
Again, you can set input Include = No
for specific Services or Transformations to exclude cross-references to them; and if you set input Ages =
Yes
for this Resource, the information will be broken down by installation age.
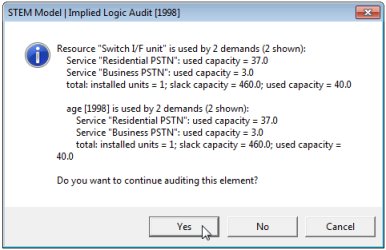
Figure 5: Age information in a *Demands audit
As you can see, there is a potentially vast amount of information, which is impractical to review in detail throughout. Nonetheless, for selected elements, these data hold the key to understanding the allocation of usage, slack capacity and costs in a given period.