STEM is supplied with a sample local-loop model which is presented in four separate views – see 1.2 Using STEM for the first time. This sample model provides a good context in which to explain how to find related elements:
- Select Open from the File menu in the Editor. The Open Model dialog appears.
- Locate the directory where STEM is installed, and then select
localoop.dtl. The model is loaded into the Editor.
- Select the Base Stations view, if it is not already visible, either from the list of views at the end of the View menu, or by selecting Open… from the same menu.
The Base station site plan, Residential PSTN,
Business PSTN and Combined Busy Hour
elements should be displayed prominently, as shown below.
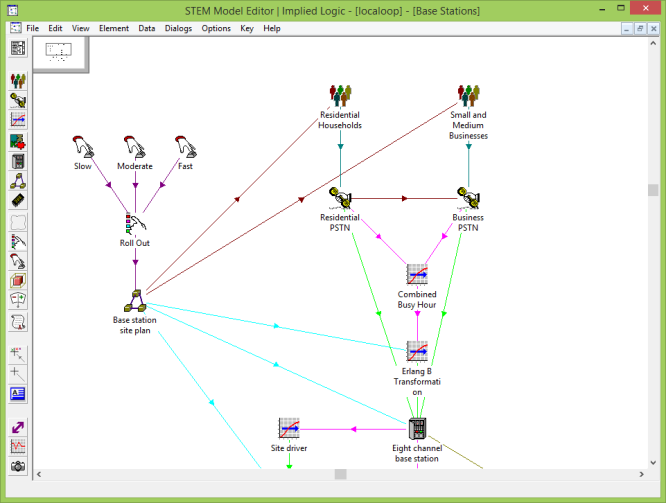
Sample model loaded in the STEM Model Editor
Showing precedents
Suppose you had no supporting documentation for this model, and you wanted to understand how one of the main Services fitted into the overall structure:
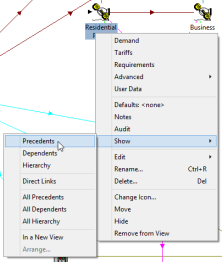
- Right-click on the Residential PSTN
icon. The popup icon menu appears, featuring a new item, Show, from which a sub-menu cascades.
- Select Show/Precedents. The icon selection is now extended to include the icon for
Residential Households, which is of course the addressable market for the Residential PSTN
Service, and a status message at the bottom of the screen reports ‘1 precedent element found’.
In the example, the one and only precedent is already visible close by, so that the effect of the Show Precedents command is clear. In general, though, an element might have several precedent elements, some without an icon in the current view, and others with icons off-screen and not directly visible. In such cases, Show Precedents creates new icons for the former, and reports the number of off-screen icons in the status bar.
Copying the selection to a new view
 If you want to avoid cluttering an existing layout, it might be preferable to copy the selected icons to another view, before using the Show Precedents command. This facility is provided as a separate command:
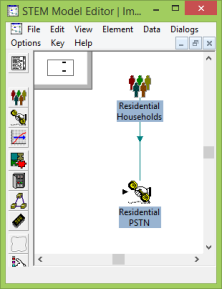
- Right-click on the Residential PSTN icon again. Both icons remain selected and a common icon menu is displayed.
- Select Show/In a New View. The two selected icons are copied into a new view.
Showing dependents
Having found the one element which has an impact on the calculations for the
Residential PSTN Service, now let’s turn our attention to the effects on the rest of the model. Assuming both icons are still selected, we can look for elements that are affected by either the Residential Households or
Residential PSTNelements:
- Right-click on the Residential PSTN icon again. Both icons remain selected and a common icon menu is displayed.
- Select Show/Dependents. 12 new icons are created in the view for the dependent Services, Transformations and Resources required by the
Residential PSTN Service. (Some of these icons may have been created off-screen, depending on the available space.)
The number of dependent icons in this case is such that, although the extent of the dependency is now clear, the structure is still somewhat opaque due to the arbitrary arrangement of the new icons. In general, the show elements commands refrain from arranging new or existing icons so as not to mess up an existing layout. However, when you judge that it is appropriate, a variety of new arrangement commands can be applied to the selection resulting from a show elements command in order to make the overall structure more apparent – see 4.21.4 Arranging elements.
Showing other linked elements
For a given element, arrows indicate the direction of links from precedent elements to that element, and similarly, from that element to any dependent elements. These arrows reflect the flow of demand (or data, for Formula and Scenario links). Certain hierarchical relationships in a STEM model do not have an associated flux, and are thus represented by links without arrows. Specifically, there is no causal link between a Function and one of its Resources, or a Collection and one of its elements; nor between a Resource and a Cost Index included in its Capital Cost Structure.
In order to trace these kinds of relationships:
- Left-click the icon for the Four Line Terminals
Resource, and then right-click to show the popup icon menu.
- Select Show/Hierarchy. The icon selection is extended to include the icon for the
Terminals
Function, which was already visible (as a co-dependent of Residential PSTN), and a new icon for the Terminal Cost Trend Cost Index.
If you want to trace all the links associated with a given element, the Show Direct Links command selects all precedent, dependent and other linked elements.
Note: It is possible to format links to alter the presence or style of arrows (although not their direction). The commentary above applies to the default attributes.
Showing an entire domain of influence
The Show Precedents and associated commands are useful for establishing cause and effect one step at a time, allowing you to focus on particular elements or selections of elements as you trace through a model. Sometimes, though, it can be equally illuminating to establish an overview of everything in a model which affects a given element (its precedents), or which is affected by that element (its dependents):
- Select the Residential PSTN
icon again, and select Show/In a New View from the icon menu in order to isolate the element.
- Now select Show/All Precedents. In addition to the
Residential Households icon, you will also see the Base station site plan, from which the addressable market is derived, as well as the Roll Out
Dimension with its three Variants, Slow,
Moderate and
Fast, which supply alternative data for the Base station site plan.
These elements represent the totality of influence on the Residential PSTN
Service.
Similarly, if you first left-click the Residential PSTN
icon to de-select the precedent icons, then the Show/All Dependents command will reveal every element which is either directly or indirectly affected by
Residential PSTN, thus revealing its entire domain of influence.
However, because of the larger numbers of icons that are likely to be revealed by these commands, the need for some further order becomes all the more pressing.