If you have a graph on the screen, in either the Editor or Results programs, the underlying numerical data can be copied to the clipboard as tab-separated text:
- Select Show Graph as Table from the Format menu. The underlying data series from the graph are presented in a graph table window.
- Click on the Layout button if you want to alter the arrangement of the data in the table, e.g., if you want to have years across rather than down – see 5.8.8 Viewing graphs as tables.
- Click on the Copy button. The data is copied to the clipboard as tab-separated text, ready to be pasted as a table into another application.
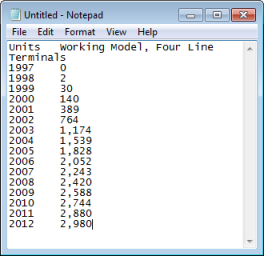
A graph shown as a table and copied as text