Now suppose that you want to examine further parameters such as Rental Tariff and Usage Tariff.
-
Back in the Editor, open the Tariffs dialog and enter a Rental Tariff of
30
and a Usage Tariff of 10.
-
Left-click on the Rental Tariff button and select Add as Sensitivity Parameter… from the Variants menu. The Choose Sensitivity for Parameter dialog appears, allowing you to choose between adding the input to one of the sensitivities that already exist, or creating a new sensitivity altogether. Click on
Sensitivity 1.
-
Repeat the process to add the Usage Tariff input to the same sensitivity.
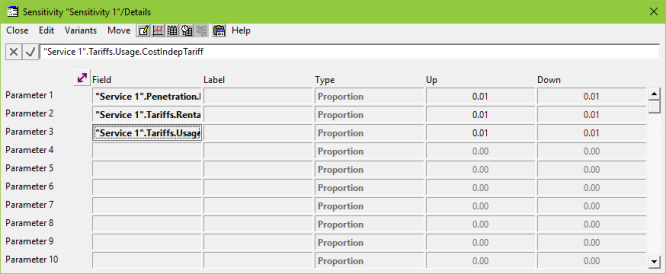
Figure 1: The sensitivity Details dialog, showing three parameters
- Use the Scenarios and Sensitivities dialog to select Sensitivity 1 (and the working model) and then re-run the model.
-
In the Results program, you will need to redraw the graph for Sensitivity 1, as there are now additional parameters. In the figure below, the results are presented in both the default Tornado and the previously chosen Time Series formats.
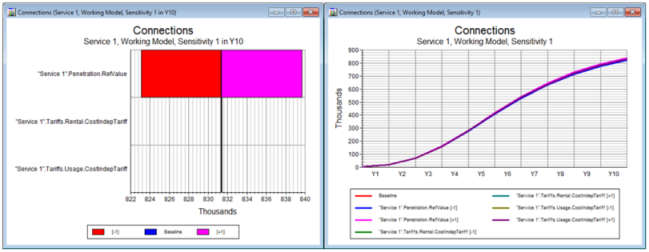
Figure 2: Tornado and time-series graphs for Sensitivity 1
As can be seen, it quickly becomes impractical to combine multiple sets of sensitivity results on a single time-series chart: there is simply too much information to present clearly. Instead, as described in Permalink ‘04060000’ not found, you can select Snapshot in the Format tab of the Draw dialog in order to draw a snapshot of all the sensitivity results at a particular time, such as at the end of the model run.
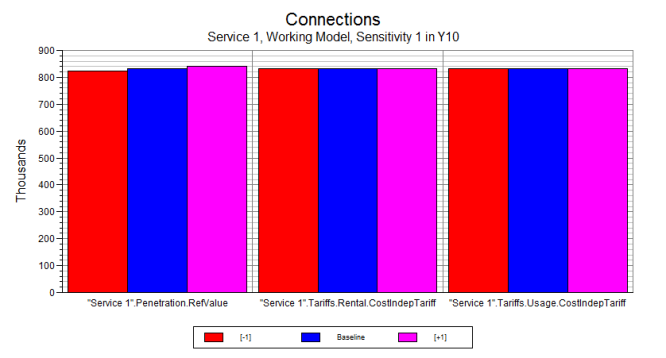
Figure 3: Snapshot of sensitivity results in Y10