You can also draw comparative graphs for sensitivities. In this context, the only option offered for the comparison base is the baseline (i.e., non-sensitivity) result. You cannot show comparisons against individual sensitivities.
- Select Difference from the Operation drop-down menu at the bottom of the Sensitivities tab window.
-
Select Baseline from the Base drop-down menu.
-
Ensure that the Basis = Tornado option is selected in the Format tab.
- Press OK to draw the graph.
The graph shows the results of the sensitivities compared with the baseline (working model) result.
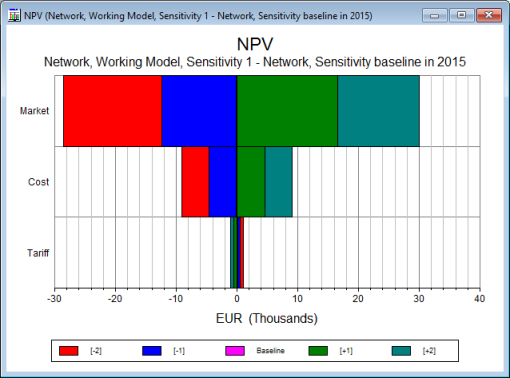
Operation Difference versus sensitivity Baseline shown on a tornado chart