For any given derived result, there may be several precedent results if its definition is elaborate. For a graph showing more than one result, the combined number of precedents could easily exceed that which could be displayed clearly on one graph. Moreover, if all precedents were automatically graphed together, it would not be clear which of those results were precedent to a given line on the original graph.
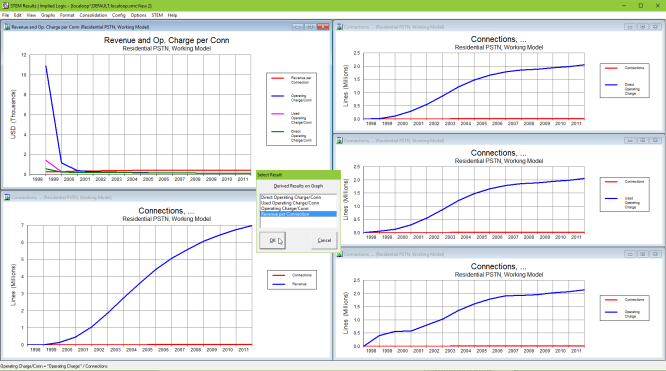
Suppose you want to audit a graph of service Revenue and Operating Charge per Connection:
- Press <F2> or select Draw Precedents from the Graphs menu. A Select Result dialog is displayed, listing the four distinct derived results on the graph.
-
Select Revenue per Connection
and click OK. Another new graph is drawn showing the precedents of Revenue per Connection, i.e., Connections and Revenue.
Auditing several results
Note: If you prefer, you can make a multiple selection in the Select Result dialog in order to combine the precedents of several results on one graph.