Suppose you have drawn a graph of Operating Profit for a particular service, and now you would like to see the constituent data from which it was calculated:
-
Press <F2> or select Draw Precedents from the Graphs menu. A new graph is drawn, showing the precedents of Operating Profit, namely Revenue and Operating Charge for the service, and the definition is displayed as a status message:
Operating Profit = Revenue – "Operating Charge".
Drawing further precedents
If you press <F2> again, you can ‘drill down’ further into the precedent data. In fact, Revenue for a service is a primitive result, so the next graph just shows precedents for Operating Charge, namely Operating Costs, Depreciation and Amortisation, and Stock Charge.
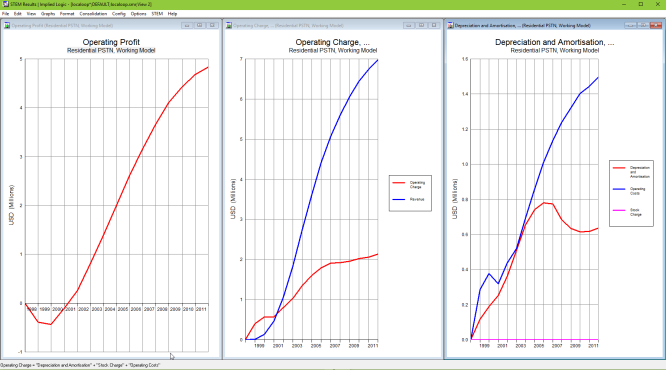
Auditing Operating Charge for a service
Note: If you want to review the calculation of Revenue for a service, or any other primitive result, switch to the Editor and select Audit from the icon menu for the corresponding element – see 4.25 Auditing the calculation of results at run time.