For a graph comparing a result between several scenarios or elements, the number of precedent data series is the product of the number of scenarios or elements and the number of precedent results identified by the original result’s definition.
Suppose you want to audit a graph of Operating Profit for three services:
- Press <F2> or select Draw Precedents from the Graphs menu.
- A new graph is drawn, entitled Operating Charge…, showing the the precedents of Operating Profit, namely Revenue and Operating Charge, for each of the three services.
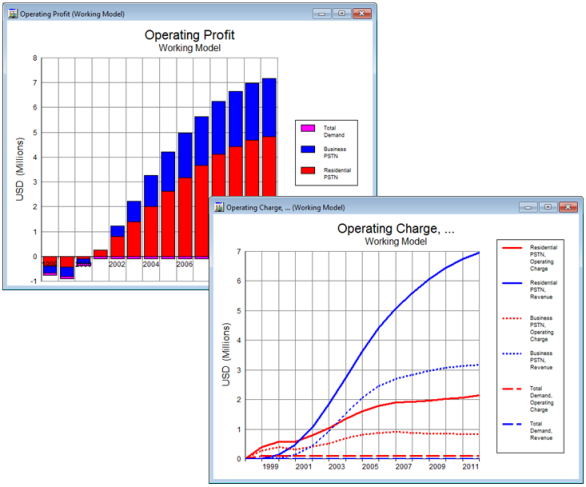
Figure 1: Auditing Operating Profit for three services
Note: if there are a large number of elements (or scenarios) on the original graph, then the number of precedent results could easily exceed the number which could be displayed clearly on one graph. You could use the Remove Series… command (see 5.3.2 Removing series from a graph) to remove some series from your original graph before drawing precedents, or you could use the Draw Similar… command (see Draw Similar) to quickly draw a graph showing only a subset of the elements/scenarios before drawing precedents, in order to simplify the resulting precedents graph.