If you want to add a new graph definition:
- Select Define Graphs… from the Config menu. The Select Graph Definition dialog is displayed, showing the list of existing definitions.
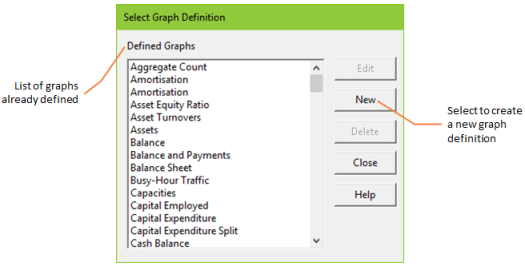
Figure 1: The Select Graph Definition dialog
- Click on the New button. The Edit Graph Definition dialog is displayed.
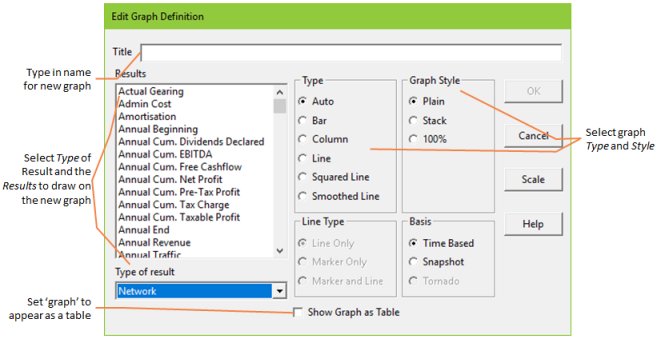
Figure 2: The Edit Graph Definition dialog
- Type a title for the graph in the title text box. (Choose something which describes the content concisely, up to 31 characters.) The title must be different from that of any of the existing definitions.
- Select the type of element for which you wish to choose the results from the Type of result list. The Results list box displays the results associated with the type of element you have selected.
- Select the results you want to appear on the graph. If you do not select any results, or if you give the graph the same name as one which already exists, STEM will display an error message ‘Bad graph definition – nothing to draw’.
- Press <Enter> or click OK. You are returned to the Select Graph Definition dialog where the new graph definition you have just created appears highlighted in the list box.
- You can add further graph definitions by repeating steps 3 to 6, or press <Enter> or click OK to return to the STEM Results menu.
If you select Show Graph as Table, the defined ‘graph’ will appear by default as a table. This is ideal for the standard financial outputs, such as the Balance Sheet, Cashflow and Profit and Loss Statements.
There are a number of ways in which you can modify the appearance of graphs created from the Edit Graph Definition dialog:
-
You can select from the options the Style and Type of graph that you want to display.
- If you want to determine how the graph will be scaled when it is drawn, click on the Scale button to open the Define Graph Scaling dialog (see below). (Graphs can also be scaled after they are displayed.)
Defining a scale for a graph
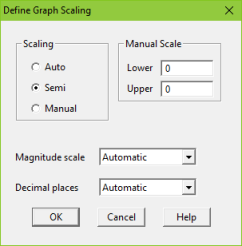
Figure 3: The Define Graph Scaling dialog
- Click on the relevant option button to determine the way the scales will look on your graph:
- Auto will make the graph fill the scale, possibly without a zero.
- Semi will make the graph fill the scale, but will always include a zero.
- Manual should only be used when you already know what the graph will look like; its main use is when you wish to compare graphs from two different model runs, and want them drawn with the same scale. If you choose manual scales, you must enter figures in the boxes for the upper and lower limits of your y-axis. (Powers of ten are represented using scientific notation, e.g., 1.0+E06.)