You can draw graphs of results and display results as tables.
Graphs are drawn on the basis of a graph definition which comprises: the results the graph displays, the type of graph (line, column, graph, etc.) and how and whether titles and axes are displayed – see 5.13 Defining graphs and tables.
STEM is shipped with a standard set of graph definitions in a default configuration file.
Graphs may contain single or multiple results according to user choice. As well as drawing graphs from one set of model results, individual graphs can also be drawn which contain results from more than one model. It is also possible to ‘drill down’ into a graph of a derived result to see the precedent results and values from which it was calculated – see 5.9 Auditing derived results.
Drawing a simple graph
- Select Draw… from the Graphs menu in the results program to open the Draw dialog.
- In the Elements tab, select the element you are interested in from the list of Available elements (e.g., DSL access) and either double-click or press the
 button to move it to the list of Selected elements.
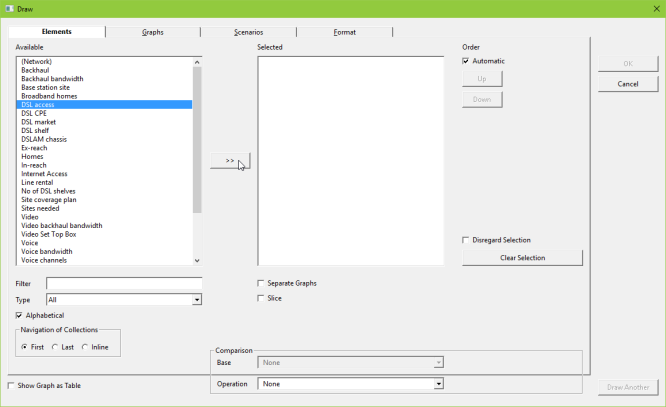
Figure 1: selection of the element DSL access in the Elements tab of the Draw dialog
- Click on the Graphs tab to move to the graph selection interface.
- Select the graph you want to draw (e.g., Connections) and click OK to draw the graph.
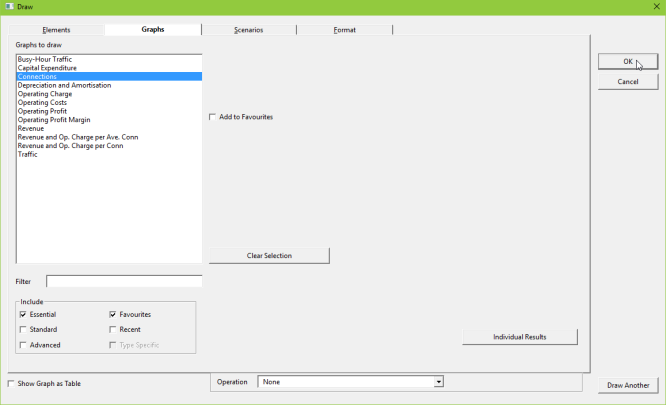
Figure 2: selection of which graph to draw in the Graphs tab of the Draw dialog.
- A Connections graph for the selected service DSL access is drawn.
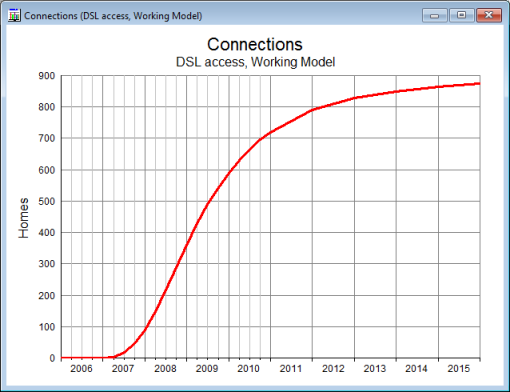
Figure 3: Connections graph for the service DSL access.
Graphs can be drawn for multiple elements (see Selection of multiple elements) and multiple results (see Selection of multiple results), and with increased levels of complexity, including scenarios (see 5.2.3 Dimensional selection of scenarios) and sensitivities (see 5.6 Selecting sensitivities; drawing snapshot and tornado charts). You can also make changes to the predefined graph format before drawing a graph (see 5.2.7 Choosing another format for a graph). These features are discussed in more detail in the following sections.