As you work through the Draw dialog, the number of graphs that will be drawn is displayed above the OK button: you may have made multiple selections across different tabs, including potentially checking Separate Graphs (always unchecked by default), so this is a useful reminder of how many graphs will be created before you press OK.
In addition, the number of series which will be drawn per graph is displayed underneath the Cancel button, including a summary of how many elements, variants, graphs and scenarios have been selected. This summary is visible across all tabs and provides a useful confirmation of the various selections made and options chosen.
Note: if only one graph will be drawn, no information is given above or below the OK button.
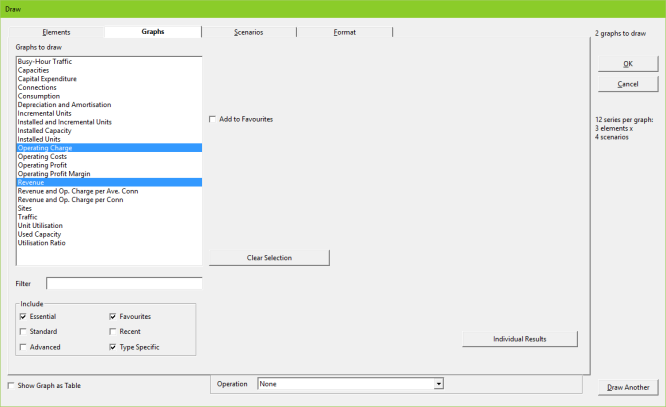
Figure 1: Information about number of graphs, series and selections made is displayed in all tabs
Check the Show Graph as Table option, which is also visible across all tabs, for the resulting graphs to appear as tables in the first instance.
Note: some pre-defined graphs, such as network Profit and Loss Statement, are always shown as a table regardless.
Press the OK button to draw the selected graph(s) and close the Draw dialog.
Draw Another option
Alternatively, if you wish to draw some more graphs straightaway, you can press the Draw Another button to draw the selected graph(s) and leave the Draw dialog open. This will enable you to draw a succession of graphs without having to completely redo the selection of all elements, variants, graphs and scenarios each time, as your previous selections will have been retained. This is particularly useful if you want to draw a succession of related graphs: for example, if you want to retain the same element and graph selections, but draw different [selections of] scenarios.
Note: the OK or Draw Another buttons can be pressed from any of the tabs in this dialog once you have selected the desired combinations of elements, graphs and scenarios.
You can also select Draw Another… from the main Graphs menu to draw another graph starting from the same selections. You can press the Clear Selection button to clear the selection in an individual tab and start afresh if required.
In contrast, the Draw… command always starts from a blank selection.
Draw Similar option
Alternatively, you can select Draw Similar… from the Graphs menu (or by right-clicking on a graph and selecting Draw Similar… from the context menu) to initiate the selections to match the currently selected active graph.