The Draw dialog can be accessed by selecting Draw… from the Graphs menu in the results program. It is a tabbed dialog, the first tab of which is called Elements and shows a list of all the Available elements in the model, arranged alphabetically by default. If the Alphabetical box is unchecked, the elements will be shown in the original order determined by the Editor.
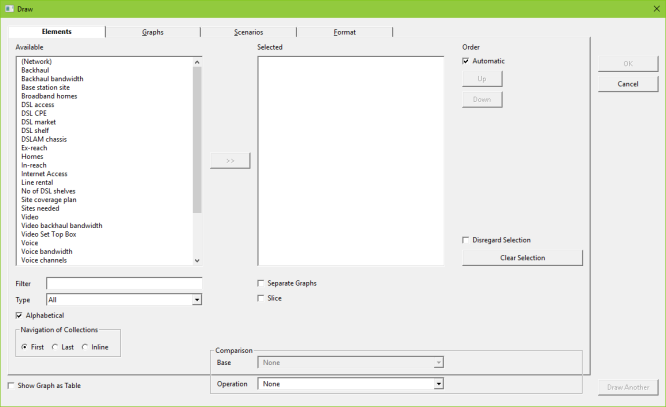
Figure 1: The Draw dialog, showing the Elements tab
You can select the elements for which you wish to draw results from the list of Available elements, including elements of different types.
If the list of elements available is long, you can use the Filter option to narrow the available choices. For example, if DSL is entered in the Filter box, only elements with this text in their names will be shown. In addition, elements can be selected by Type; for example, you can show just resource elements.
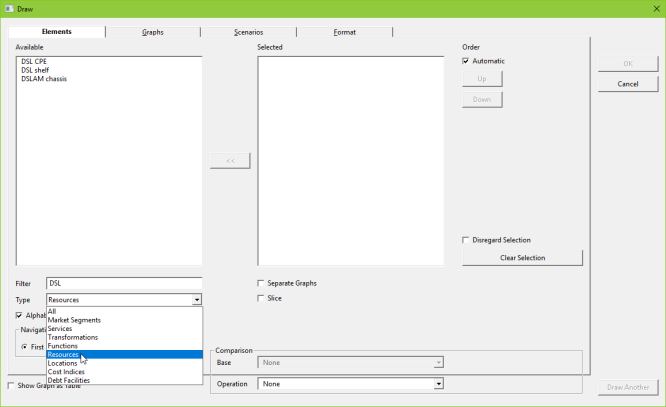
Figure 2: Using the Filter and Type options to keep the Available list manageable
Elements can be added to the Selected list one at a time by double-clicking. Alternatively, you can select an element and then either drag it across or click the  button to move it. The Selected list makes it easier to see which elements are selected to graph, especially when they are far apart in the Available list. Multiple elements can be selected in the usual way, using <Shift + click>
for a contiguous selection or <Ctrl + click> for a non-contiguous selection.
button to move it. The Selected list makes it easier to see which elements are selected to graph, especially when they are far apart in the Available list. Multiple elements can be selected in the usual way, using <Shift + click>
for a contiguous selection or <Ctrl + click> for a non-contiguous selection.
The reverse process can be applied to remove elements from the Selected list – a reverse  button is shown when the focus is on elements in the Selected list, and can be used to return elements to the Available list.
The example below shows how you can select the service element DSL access and resource elements DSL shelf and DSLAM chassis together and move them to the Selected list.
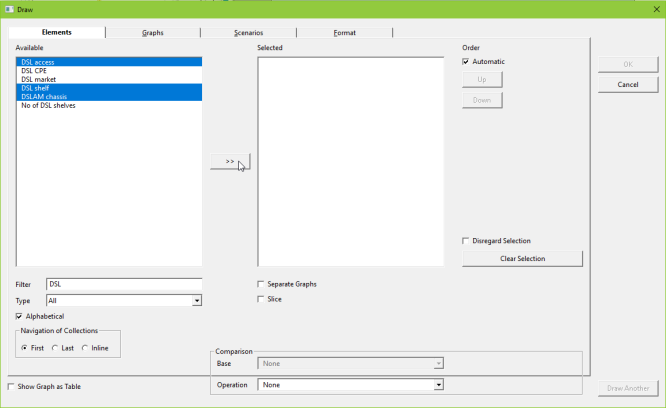
Figure 3: Selecting different types of element simultaneously and adding them to the Selected list
By default, the Selected elements are shown in the Automatic order determined by the Editor. You can use the Up and Down buttons to move elements within the list, which will determine the order in which the elements are presented on the resulting graph.
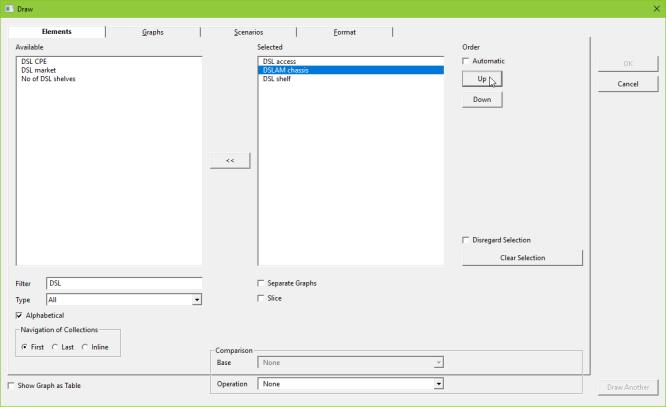
Figure 4: Changing the order of elements in the Selected box using the Up/Down buttons
Earlier versions of STEM had an All Elements on One Graph option which was ‘sticky’ in the sense that, once unchecked, it would stay unchecked. In contrast, the option is inverted from STEM 7.5 onwards as Separate Graphs, and this is always unchecked by default, so that you have to actively opt-in to display elements on separate graphs. The rationale for this change is that it is more straightforward to remove a single graph showing, say, 12 results, than to remove 12 separate results graphs drawn by mistake!
The Slice option is explained later – see 5.3.4 Slicing between a shortlist of elements.
The Elements tab is simply step one of a tabbed interface. You can click on any of the other tabs to access and change what lies beneath. The tabbed interface makes it easy to skip repeat selections for a series of graphs as previous selections are retained, as well as making it straightforward to review your selections before ‘pressing OK’. The other tabs in the process are described in more detail in the following sections.