One of the most practical and helpful aspects of the new results functionality is the ability to change what is shown on an existing graph:
- Select Change Selections… from the main Format menu, or right-click on the graph background and select Change Selections… from the context menu.
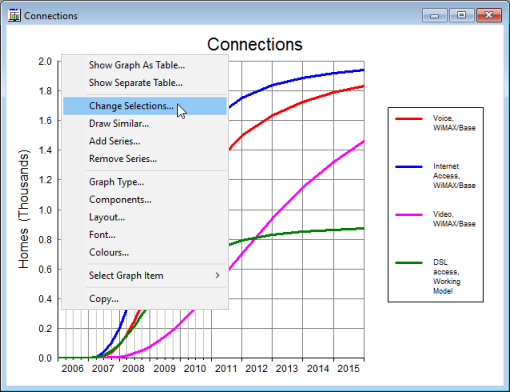
Figure 1: Selection of Change Selections… option from the graph context menu
-
The Change Selections dialog opens: this is essentially the same interface as when creating a new graph, but without the Separate Graphs option.
-
Alternatively, right-clicking on a specific graph item (e.g., legend or minor title) and selecting Change Graph Selection…, Change Result Selection…, Change Scenario Selection… or Change Element Selection… will take you to the relevant tab in the Change Selections dialog. For example, if you select Change Scenario Selection…, you will go directly to the Scenarios tab, whereas if you select Change Graph Selection… or Change Result Selection…, you will be taken directly to either the Graphs or Results tab, depending on whether you chose a pre-defined graph or an individual result originally.
Note: double-clicking on a specific graph item will also take you directly to the relevant tab in the Change Selections dialog.
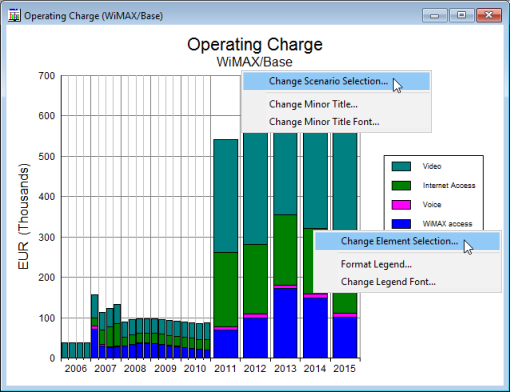
Figure 2: Different context menu choices determine which tab you reach in the Change Selections dialog
- You can review your current selections in the tab, and can remove selections, or add them if you prefer. When you press OK, your current graph is updated with the new selections, but without changing any of the other original selections (e.g., if you have selected a different scenario, the original element and result selections will remain unchanged): in the example below, the original WiMAX/Base scenario has been retained, and the DSL/Base scenario added.
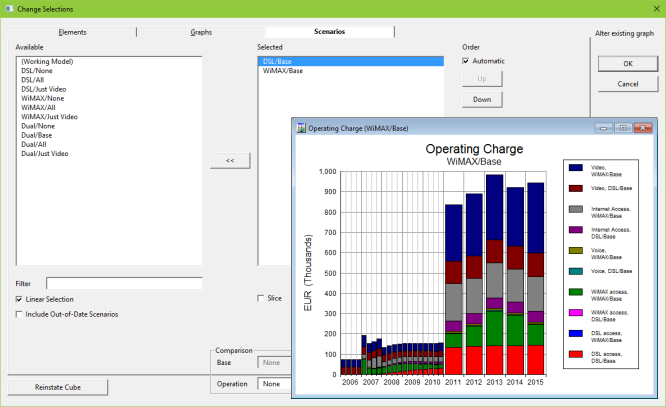
Figure 3: Changing scenario selections in the Change Selections dialog
If the graph has every relevant combination implied (i.e., all selected elements × results × scenarios combinations) it is obvious how this should work. However, it is possible (and indeed, likely, if you have used the Add Series… or Remove Series… commands) that a graph will show just a sparse subset of the possible series, in which not every possible combination is shown. The Change Selections dialog accommodates this by presenting the initial selections in each tab to reflect each element, result and scenario which is present in at least one series on the current graph. Existing gaps will be preserved (e.g., if some scenarios are present for only some results this will be maintained), but all relevant combinations will be added if you select a new element, result or scenario.