The Change Selections… command allows you to click on anything that displays what is in a graph and change what is presented. However, this is over-complicated if, for example, all you want to do is switch to a related element: you will be taken back to the full element-selection interface each time, and potentially a very long list of elements from which to choose.
It is now possible to use the selection of elements (or results or scenarios) as a shortlist for a graph, which it will be simple to slice between.
- Select the elements that you want to graph in the Elements tab of the Draw dialog (e.g., DSL access, Internet Access, Video, Voice and WiMAX access).
- Move to the Graphs tab and select the result you want to graph (e.g., Operating Charge).
- Switch to the Scenarios tab and select the scenarios you are interested in (e.g., DSL/Base, WiMAX/Base and Dual/Base).
- Select the Slice checkbox in the Scenarios tab (unchecked by default) and then select the scenario you want to appear in the graph by default (DSL/Base in this example).
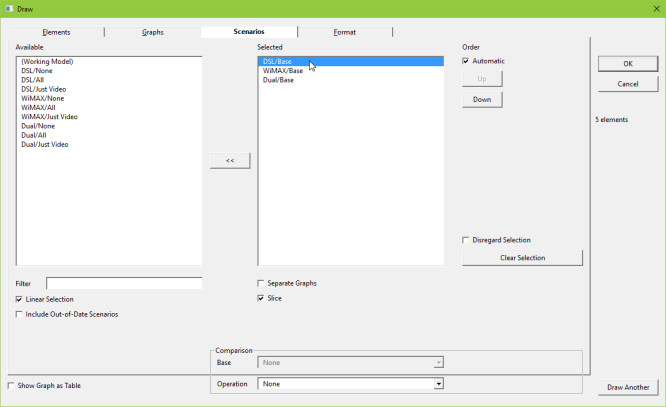
Figure 1: Selection of Slice option and of which scenario to show on graph by default (DSL/Base)
- Press OK. A graph is drawn showing the Operating Charge result for the five services, but just showing the DSL/Base scenario.
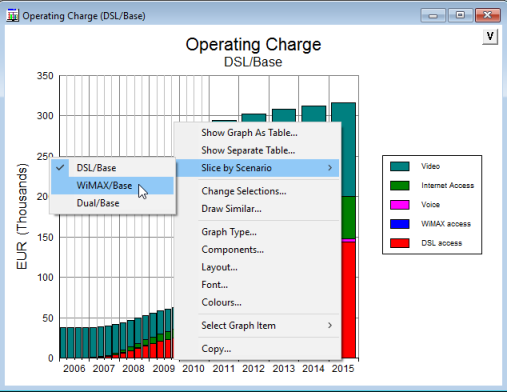
Figure 2: Graph showing single scenario slice and Slice by Scenario option for other shortlisted scenarios
-
If you right-click on the graph and select Slice by Scenario from the context menu you can choose to switch between graphs of the shortlisted scenarios: selection of the alternative WiMAX/Base scenario, for example, will change the graph to one showing the Operating Charge result for the five services in the WiMAX/Base scenario.
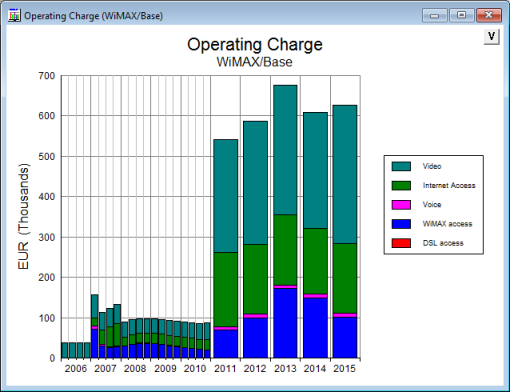
Figure 3: Graph resulting from selection of alternative scenario slice
- Alternatively, if you position the mouse over the scenario portion of the minor title, or over the
 in the top right-hand corner of the graph window, you can select the alternative scenario slice you want to view from the resulting drop-down menu.
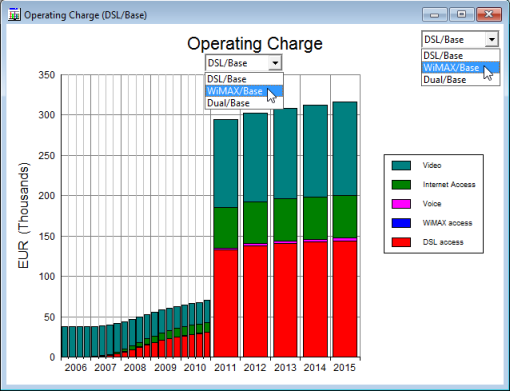
Figure 4: Selection of alternative scenario slices from drop-down menus
This new functionality makes it very easy and inviting to change between a selection of related scenarios (or elements or results).
It is also possible to have more than one slice (e.g., elements and scenarios). In the previous example, if you had selected the Slice option in the Elements tab, as well as in the Scenarios tab, the resulting graph would show the result for a specific element/scenario combination for Operating Charge. If you right-click on the resulting graph, the Slice option allows you to select different slices through both the scenario and element spaces. This is a very powerful tool enabling you to create an intuitive and more interactive results presentation.
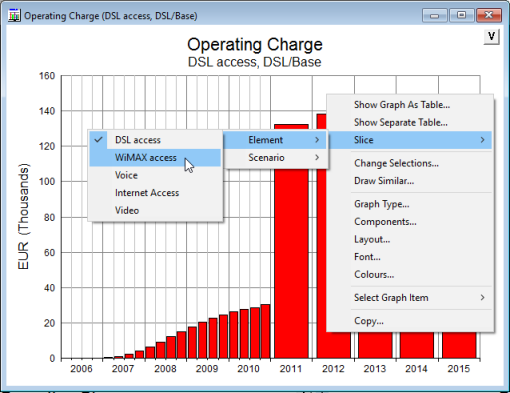
Figure 5: Selection across two different slices: element and scenario
Note: you can also select different element/scenario slices from drop-down menus, in the same way as shown in Figure 4.
Note: you can also slice by variant, as explained in Slicing by variant.