In the results program in STEM 7.4, the elements to draw in a replicated model were shown in a single list, including all the (potentially very many) replicated elements. As an example, if you replicated all the core elements in the example WiMAX model by adding a template element (Sites), with ten variants (Sites 1–10), the model structure would look as shown below.
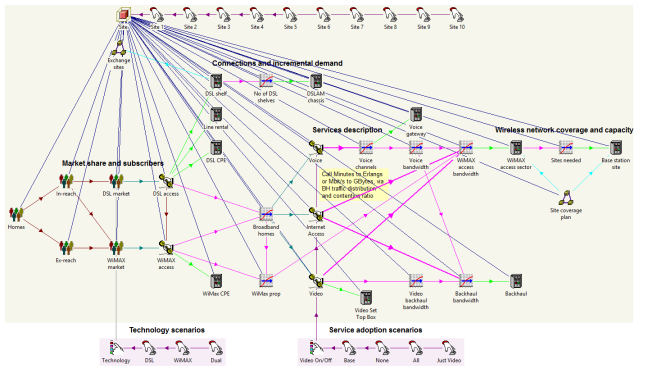
Figure 1: Replicated WiMAX-DSL model, with one template (Sites) and ten variants (Sites 1–10)
After running the model and starting to draw a graph, the Choose elements to draw dialog would have included every one of the variants for each element (e.g., DSL Access, DSL access/Site 1, DSL access/Site 2, … DSL access/Site 10). The list could very quickly become long and confusing, as it was essentially two dimensions of choices flattened into one cumbersome list.
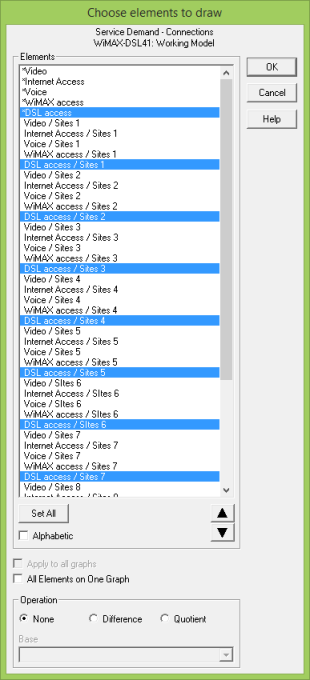
Figure 2: Selection of elements to draw in STEM 7.4 – long list of element/variant pairs to choose from
From STEM 7.5 onwards, you select the elements first, followed by a separate selection of the variants of interest. Only the original replicants are shown in the Elements tab of the Draw dialog – the available variants are listed in a separate Variants tab, which is only displayed if a model includes template replication.
The elements and variants you want to display on a graph can be selected as follows:
- From the Elements tab in the Draw dialog, select the elements you want on your graph (e.g., DSL access, DSL shelf and DSLAM chassis).
- Switch to the Variants tab. For any element selected in the Elements tab that was replicated, the available variants will be listed here, together with an (all) item to select the *replicant collection result (e.g., (all Site variants) is the aggregate of all DSL access elements across all sites: DSL access/Site 1 + DSL access/Site 2 + … + DSL access/Site 10).
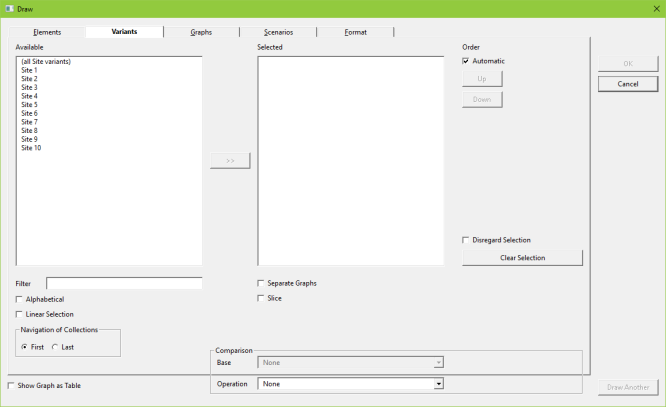
Figure 3: List of available variants in Variants tab in STEM 7.5
- Select the variants you want from the list of Available variants, either by clicking or using the
 button to add them to the Selected list, as in the Elements tab.
- Move to the Graphs tab and select the result you want to graph (e.g., Operating Charge). Press OK to draw the graph.
The replicant/variant combinations selected across both tabs will be graphed. If Site 1 and Site 2 are added to the Selected list in this example, six series will be drawn on the resulting graph, these being:
-
DSL access/Site 1
-
DSL access/Site 2
-
DSLAM chassis/Site 1
-
DSLAM chassis/Site 2
-
DSL shelf/Site 1
-
DSL shelf/Site 2.
This is an elegant and concise way of selecting what you actually want to see on a graph.
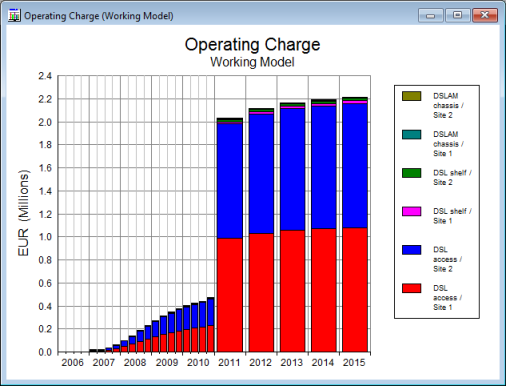
Figure 4: Operating Charge result for 3 × element/2 × variant combinations
If no relevant variants are selected then, by default, the aggregate graph for [sum over all variants] (all site variants in this example) will be drawn.
If there are multiple templates in a model, then all relevant variants will be shown for each template associated with a selected element. So, in our example model, if we add an additional Service 1 and Resource 1 in a separate Template 1 with Variants 1–3, then both sets of variants would appear in the Variants tab (see image below) if at least one original element from each template is selected in the Elements tab.
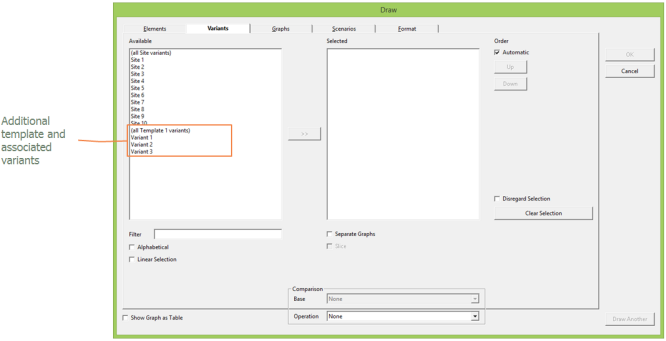
Figure 5: List of available variants from multiple templates in the Variants tab in STEM 7.5
If the Linear Selection option is checked, then rather than listing the variants in template groups, instead all possible element/variant combinations are shown in a linear Available list, as they would have been in STEM 7.4. This enables you to select specific element/variant combinations if required, but can result in a lengthy list if there are many element/variant combinations. The selections in the Selected list will also be shown linearly if this option is checked, so you will be able to see exactly which element/variant combinations will be graphed. Linear Selection is unchecked by default.
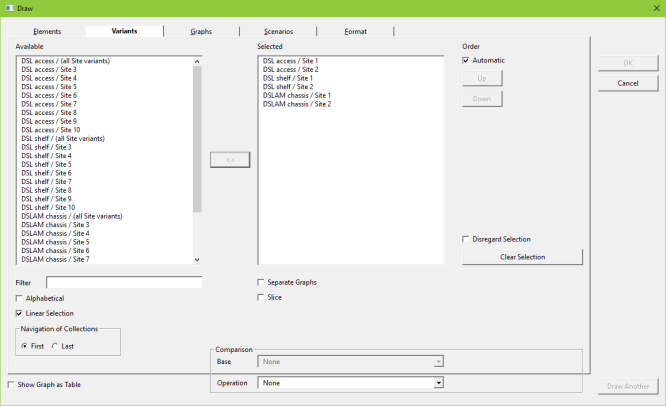
Figure 6: Linear display of available element/variant combinations
As in the Elements, Results and Scenarios tabs, the Separate Graphs option is always unchecked by default.
The Slice option is explained in more detail in 5.3.4 Slicing between a shortlist of elements: you can Slice by Variant, as illustrated below.
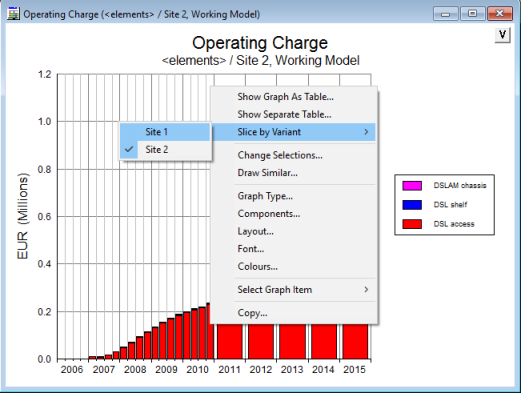
Figure 7: Slicing between a shortlist of variants, allowing highly interactive presentation of results