If you want to combine several graphs on one page:
- Select the Arrange Graphs option from the Print dialog (accessed from the File menu). The Graph Arranger dialog is displayed. It contains a representation of the ‘page’ with margins on which selected graphs will appear. By default there is space for two graphs on the page.
- Left-click on the centre of a graph and drag to the Graph Arranger window. The cursor changes from a cross to a graph icon over the grey rectangles, which represent spaces on the page. Release the mouse button to copy the graph into the first space. Repeat to copy another graph into another space.
- Click on the Options button if you want to increase the number of spaces available.
- Click Print to send your arrangement to the printer.
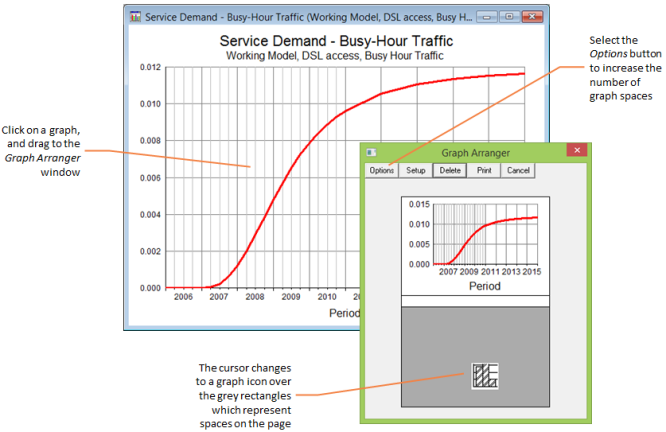
Dragging a graph onto the Graph Arranger window
Dialog options
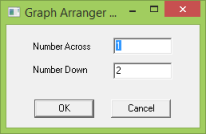
Options displays the Graph Arranger Options dialog to change the number of graphs that appear on a page:
Number Across defines the number of graphs that will appear in a row across the page.
Number Down defines how many graphs will appear in a column down the page.
You can change the internal margins of the page by clicking and dragging on the lines that represent the margins.
Note: To return margins to their default, click on the Options button and change the setup so that Number Across is 1 and Number Down is 2 and click OK.
Setup displays the Setup dialog to define the print parameters for the page.
Delete removes the selected graph from the page layout. (The selected graph is highlighted by a dotted rectangle around it.)
Print returns to the Print dialog, where the selection will have changed from Arrange Graphs… to Arranged Graphs.
Compatibility
The STEM Results program is capable of printing to almost any printer installed under Windows, either connected directly to your machine, or accessed via a network connection. If you have a colour printer, graphs will be printed in colour; otherwise bars, columns, lines and areas will automatically adopt monochrome patterns instead of the colours.