Since the business model may be quite sensitive to the assumed contention ratio, we are going to add some scenarios to the model to allow us to readily compare the business performance for different contention ratios.
 Save the model as WiMAX-DSL09
- Select the Contention Ratio field in the Demand dialog for Internet Access and set it back to the original value of 50.0.
- Select Add as Scenario Parameter… from the Variants menu on the dialog. The Choose Dimension for New Parameter dialog is displayed.
- Double-click <new Dimension>. Four new elements are created: Dimension 1 and Variants 1, 2 and 3. In addition, the Variant Data dialog is displayed with the original value of 50.0 copied into the three columns for Variants 1, 2 and 3.
- Change the values for Variants 2 and 3 to 25.0 and 10.0, respectively.
- Click the
 button on the toolbar and then click again within the view to create an additional Variant 4. An extra column is added to the Variant Data table.
- Enter the value 1.0 for the last variant.

Note: If you close the Variant Data table, you can access it again by selecting Variant Data from the icon for the new Dimension. This automatically presents the data for all the related variants side-by-side.
- Select Scenarios and Sensitivities from the File menu. Each of the original scenarios appears four times, with a variant for each of the new variants we have added. In other words, the scenario space is now technology × video × contention ratio.
 Save and run the model
-
Select the four consecutive scenarios Dual/Base/Variant 1 – 4 and then click Selection in the Save and Run box to run these four scenarios.
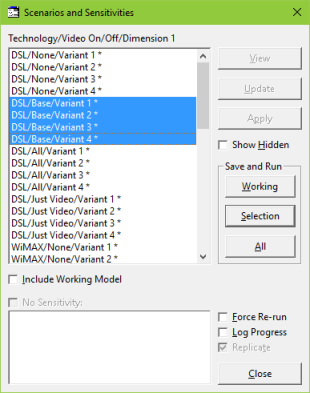
Note: by default, STEM creates a scenario for every possible combination of variants for all dimensions, so the number of scenarios can become large very quickly. To hide scenarios that you are not interested in or to shorten and simplify the list of scenarios, simply right-click on the scenario(s) you want to hide, and select Hide Scenario(s). To unhide a scenario, select the Show Hidden checkbox. Scenarios that have been hidden will appear in square brackets. Select and right click on the scenario(s) you wish to unhide and select Unhide Scenario(s). A scenario can also be renamed by selecting and right-clicking on the scenario you wish to rename, and selecting Rename Scenario.
- Select Draw… from the Graphs menu and select NPV in the Graphs tab. (Note: if you don’t select any specific elements in the Elements tab, it is assumed that you have chosen Network.)
- Enter the Scenarios tab. The four scenarios you have just run should be listed linearly in the Available box. (If this is not the case, then check that the Linear Selection option is selected underneath the Available box. If the Include Out-of-Date Scenarios option is checked, then the scenarios that are out-of-date are also listed in square brackets to denote that they are not up-to-date.)
- Select the four scenarios (Dual/Base/Variant 1–4) and add them to the Selected box. Click OK to draw the graph. See how the business performance compares.
- Draw the graph again, by right-clicking on the graph and selecting Draw Similar… from the graph context menu. Your selections from the original graph will have been retained. In the Scenarios tab, set Operation to Difference in the Comparison area, and select Dual/Base/Variant 1 as the Base result.
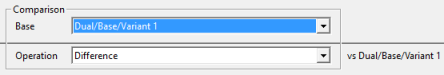
- Press OK to draw the graph. Now the graph shows the NPV of the other scenarios compared to the original assumption.
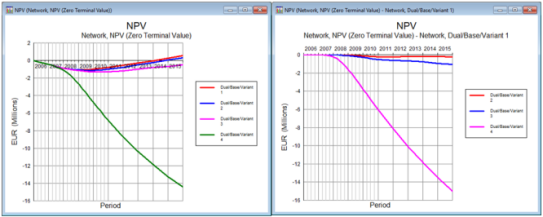
- This kind of ‘NPV delta’ is often taken as a decision metric against a reference or do-nothing scenario.
 Things that you should have seen and understood
Dimension, Variant, Scenario, Show/Hide/Rename Scenarios
Draw Similar, Operation, Difference, Base result