In the age of ecological responsibility, one tries not to waste too much paper with transient print-outs, but for completeness we will use this final exercise to explore the options offered by STEM to create hard copy.
If no printer is available in the training room, or you simply prefer not to waste paper, then you can use the Microsoft XPS Document Writer, which prints to a (coloured) xps file on your computer.
 Save the model as WiMAX-DSL55
All of the Editor’s print options are presented together in one place:
- Select Print… from the File menu, or press <Ctrl+P>. The Print dialog is displayed, with the various options listed in a listbox.
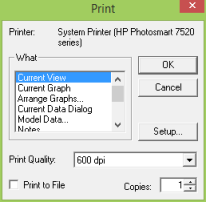
- Select the desired item from the list and click OK, or just double-click the item. The item is printed.
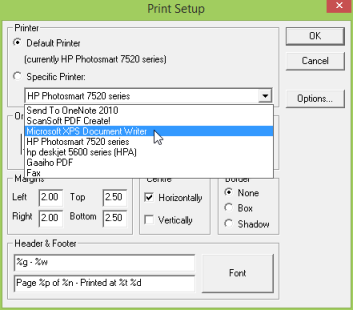
- Click Setup first, or select Print Setup… directly from the File menu to change the printer (e.g., to Microsoft XPS Document Writer), or orientation, or to change the base font for text-based output such as Model Data (see below).
- Double-click Current View. The current view is printed. Given the usual aspect ratios, this normally works in landscape format.
- Double-click Visible Views. All of the open views are printed, one per page.
- Double-click Current Graph. The current graph (if any) is printed. (You can also print a graph directly from the Graph dialog menu.)
- Double-click Visible Graphs. All of the open graphs (if any) are printed, one per page.
- Double click Arrange Graphs… A Graph Arranger window appears. Left-click on the area of the Graph Arranger window where you want to insert a graph.
- Drag-and-drop individual graphs into the selected area of the window to print multiple graphs per page.
- Double click Current Data Dialog. The current data dialog (if any) is printed.
- Double-click Visible data Dialogs. All of the open data dialogs (if any) are printed, one per page.
- Double-click Model Data… The Print Model Data dialog appears.
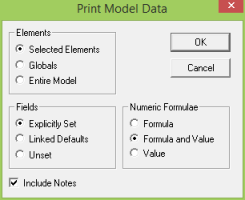
- Select which elements you would like to print (press <F1> for an explanation of the other options) and click OK. A neatly formatted report is created using the base font defined in the Print Setup dialog.
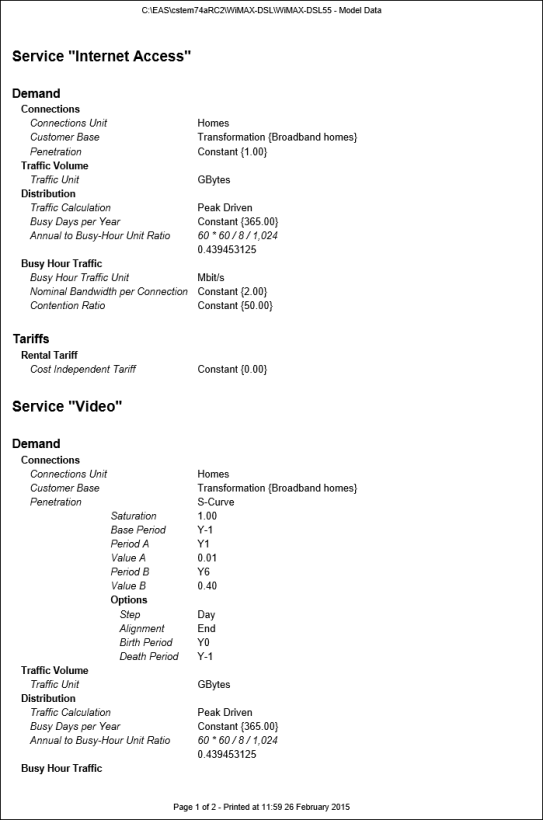
By default this will include the same detail as shown in the tooltip or floating window which is displayed when you hold the mouse over an icon.
- Double-click Notes. A listing of all the notes in the model is generated using the base font defined in the Print Setup dialog.
- Double-click STEM.INI. A listing of the STEM.INI file is generated using the base font defined in the Print Setup dialog.
Printing from the Results program
The procedures for printing from the Results program are identical, but remember that it is a separate process, and that you will therefore need to change the printer independently if you already did so for the Editor.
- Double-click Current Graph. The current graph (if any) is printed.
- Double-click Visible Graphs. All of the open graphs (if any) are printed, one per page.
- Double click Arrange Graphs… A Graph Arranger window appears. Left-click on the area of the Graph Arranger window where you want to insert a graph.
- Drag-and-drop individual graphs into the selected area of the window to print multiple graphs per page.
- Double-click Current Graph’s Table. The current graph (if any) is printed as a table.
- Double-click Visible Graphs’ Tables. All of the open graphs (if any) are printed as tables, one per page.
 Things that you should have seen and understood
Printing views, graphs, graphs’ tables, data dialogs, model data, notes, STEM.INI
Print, Print Setup, Print Model Data