The purpose of the model is to compare DSL and WiMAX technology scenarios as alternatives, and also side-by-side; but first we will explore the basic model structure and results.
Fixed network access provisioning and ports
Each DSL access customer requires a DSL modem. Line cards are supplied in units of packed shelves with 320 ports (20 ports per card × 16 cards per shelf). The DSLAM chassis can accommodate up to five shelves, and the DSLAM backplane throughput capacity is assumed to be ‘enough’ to satisfy the nominal requirements of the expected services.
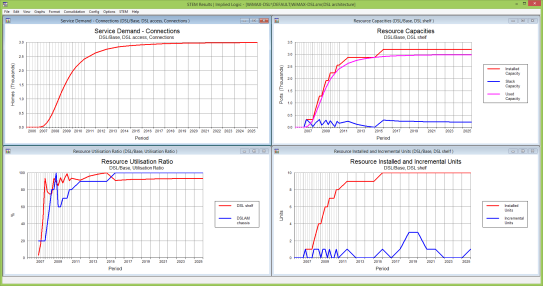
Figure 1: DSL installation and utilisation
Traffic characterisation and service aggregation
The key demand drivers of the model are as follows. DSL access customers drive DSL ports. Busy-hour Erlangs drive channel-based voice bandwidth. Voice, Internet and video bandwidth drive WiMAX capacity, whereas Voice and Internet plus video-feed bandwidth drive backhaul.
Traffic characteristics for voice and data services are described quite differently. The voice model for service uses a volume-driven approach, using distribution parameters to calculate the busy-hour traffic in Erlangs from average daily or annual call minutes per user. In contrast, the Internet service uses a peak-driven approach, first specifying a nominal peak bandwidth, e.g., 2Mbit/s, and a contention ratio, and then using similar distribution parameters the other way around to calculate the monthly or annual traffic volume in GBytes.
The IPTV service is initially modelled with a nominal 5.5 Mbit/s data rate, but this may be more prudently described with a blocking model working from video minutes.
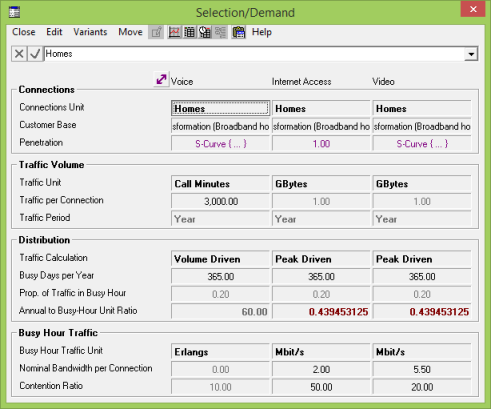
Figure 2: Services and traffic characteristics for voice and data
WiMAX roll-out, coverage and upgrade capacity
One WiMAX CPE is required for each customer of the WiMAX access service. Ten base-station sites are rolled out for coverage over two years, and then additional WiMAX access sectors are added in steps of 30 Mbit/s capacity according to a distribution of slack capacity across the ten sites. The model assumes an average of 15 Mbit/s slack capacity at any one site, and this results in the first upgrade (one site reaching 100% utilisation) when the average over the network is 50%.
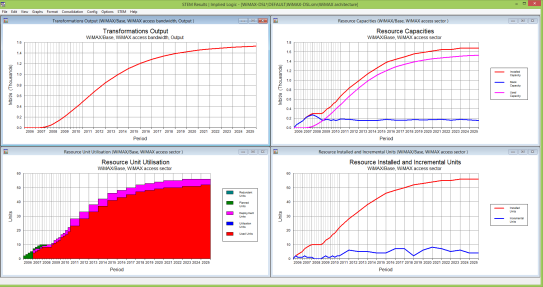
Figure 3: WiMAX drivers: roll-out, coverage and bandwidth
The STEM model automatically aggregates revenues over services, and similarly capex and opex across the various elements of the network, to quickly provide overall profit and cashflow results, as well as detailed financing and valuation results, all of which can be used as metrics for comparing different strategic options from different perspectives.
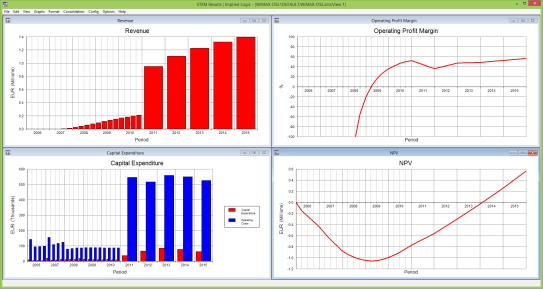
Figure 4: Business evaluation and return on investment