Modelling demand for the fixed access network at just one site is not very challenging: the complexity arises from varying characteristics across multiple sites. STEM's built-in deployment feature allows you to express the fact that a single demand is spread over one or more physically separate sites, and this is what drives the WiMAX upgrade path described above on a macro-economic basis without modelling each site in turn.
Now we will turn our attention to the DSL installation and consider how we would extend this model to cover multiple exchange sites.
 Save the model as WiMAX-DSL39
- Increase the size of the Homes market by a factor of ten to 20,000 (icon menu/Details).

 Save and run the model
- Draw the Resource Capacities graph for the DSL shelf.
What is wrong with these results?
Location 
- Go back to the Editor and click the
 button on the toolbar and then click again within the view to create a new location. Name it Exchange sites.
- Set the number of Sites = 10.0 (icon menu/Details).
- Use drag-and-drop, or the connection tool, to link this new location element to the DSL shelf resource. A light blue link appears, which indicates that the deployment of this resource is spread across the ten distinct sites.

- Run the model again and note the changes.
What does this default behaviour assume about the distribution of demand across the ten sites?
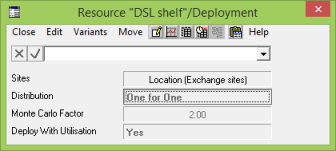
- Go back to the Editor and review the deployment assumptions for the DSL shelf (icon menu/Deployment).
- Or you can double-click the light-blue deployment link. The Deployment dialog is displayed.

- Try experimenting with the options for the Distribution input, running the model each time to compare the results.
- Try changing the Monte Carlo Factor to see how it influences the relevant distributions.
Which do you think is most realistic for the situation we are modelling?
- Save the results workspace before you proceed.
- If there is time, look at the results for the DSLAM chassis and see if you can apply the same technique to improve them.

The Extended Monte Carlo distribution combines characteristics of the One for One and Monte Carlo distributions. It guarantees at least one unit per site, and assumes an average of half a unit of slack capacity (160 ports) at each site (even though the numbers will vary per site in practice). This is a reasonable assumption in the absence of much more detailed data, and captures a significant overhead cost (compared to the minimum installation) which is sometimes neglected in hastily crafted business plans.
 Things that you should have seen and understood
Estimating slack equipment capacity across a distributed network, Extended Monte Carlo
distribution
Location, Sites, Deployment, Distribution, Monte Carlo Factor