Suppose we do have access to specific market size data on a per-site level, and possibly even different penetration growth curves. Although we could run the model over and over for each site in turn, this would not be very practical for a detailed scenario or sensitivity analysis, nor would it give you results for the network business as a whole.
First we will use manual copy and paste to split the model down to this level and visualise which elements need to be repeated.
 Save the model as WiMAX-DSL40
- Select the Homes icon and then hold down the <Ctrl> key and click the following elements individually to make a multiple selection:
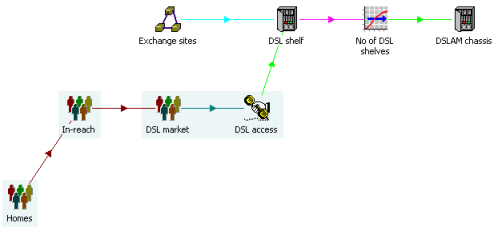
- Right-click one of the selected icons and select Show/In a New View from the icon menu. The selected icons are copied into a new view.
The new icons refer to the same underlying data as the previously selected icons in the original view: the elements themselves have not been copied.
- With all the new icons still selected, use copy and paste (main Edit menu/Copy and Edit/Paste Elements), or drag-and-drop using the <Ctrl> key, to make several copies of the selected elements. (You may prefer to re-arrange the icons more compactly before you do this.)
You should end up with something like this:
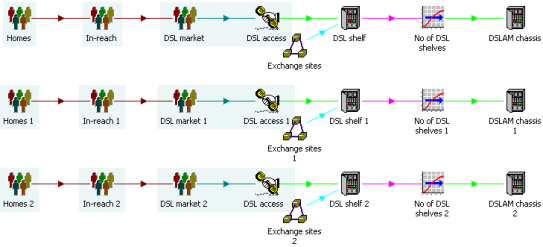
- Enter some new data for the individual Homes market elements, somewhere in the range 1000–3000, and set Sites = 1.0 for each of the Exchange sites location elements.
- Don’t bother renaming the individual elements. We will use a much more elegant technique for this purpose in the next exercise!
 Save and run the model
If you still have the Resource Capacities graph from the previous exercise, it will now show you the results for the original site with no deployment. In other words, the installed capacity will increase in steps of one unit (320 ports) as demand increases.
- Draw the Resource Capacities graph again for all of your copied DSL shelf elements and tile the graphs (Graphs menu/Tile).
You will see STEM performing the same consistent calculations for each site in turn, installing different numbers of shelves according to the overall level of demand in each site.
 Things that you should have seen and understood
Icons for the same element in different views
Show/In a New View, Edit/Copy, Edit/Paste Elements