STEM can provide a detailed breakdown of the resource origin of all of the costs allocated to a service. However, the operation of separate parts of a network may be broken down into separate business units. This final technical exercise shows how such a structure can be represented in STEM.
 Save the model as WiMAX-DSL50
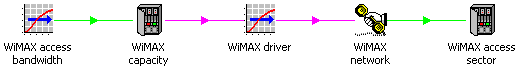
Look at the WiMAX radio network. This is currently modelled with just two resources, WiMAX access sector and Base station site, whereas a detailed commercial model might require twenty or more separate cost lines for this aspect of the network alone. We are going to separate the concept of a WiMAX Mbit/s from the necessary, underlying costs.
- Break the link between the WiMAX access bandwidth transformation and the WiMAX access sector resource (link menu/Unlink).
- Create a new resource called WiMAX capacity, a new transformation called WiMAX driver, and a new service called WiMAX network.
- Create a requirement for WiMAX capacity from the WiMAX access bandwidth transformation.
- Set WiMAX capacity as the input for WiMAX driver.
- Set WiMAX driver as the input for WiMAX network, choosing Customer Base as the relevant input when prompted.
- Create a requirement for the original WiMAX access sector from WiMAX network.
- For the WiMAX capacity resource, set the inputs Capacity = 1.0 and Capacity Unit = Mbit/s (icon menu/Capacity and Lifetime).
- Change the Type of the WiMAX driver transformation from Multiplier to Resource, and then set the input Basis = Used Capacity (icon menu/Input and Transformation).
- Set the following traffic inputs for the WiMAX network service (icon menu/Demand). You may find it easier to copy the conversion inputs from the Internet Access service.
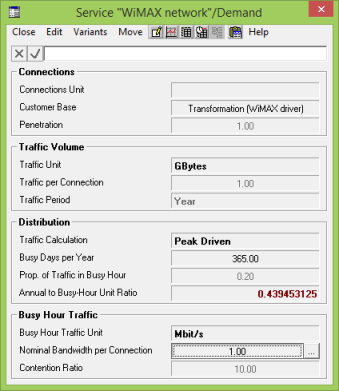
- Set the input Value Chain = Cross Charge for the WiMAX network service (icon menu/Advanced/Other Details).

This value chain module in STEM only works if the service is driven by a resource transformation (which guarantees the necessary cost-allocation mechanism). Currently, it must specifically drive the Customer Base input, although Traffic per Connection may be allowed in future.
The Commodity option for the Value Chain input relates to the production of services or equipment (which may be depreciated over time) by a third party, where the cost of the commodity is replaced by the tariff charged by the third-party service. This concept is beyond the scope of the current training course.
 Save and run the model
- Draw the Resource Capacities chart for WiMAX access sector.
You should see the same results as before, i.e., that additional capacity is installed as the used capacity gradually increases beyond 150Mbit/s.
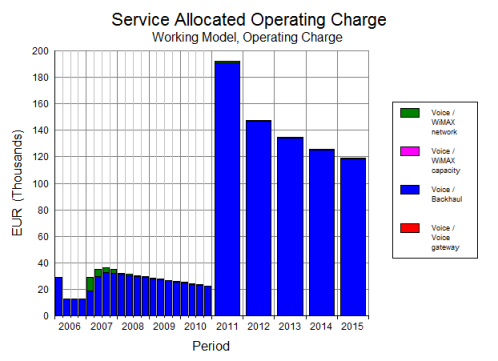
- Draw Service Allocated Operating Charge for the Voice service.
You will find just three elements presented in the second Choose elements to draw dialog: Voice Gateway, Backhaul and WiMAX capacity. The WiMAX access sector and Base station site elements within the WiMAX network are now suppressed.
Uncheck 2D selection to access service / service results
However, we would like to get a total allocated cost for the WiMAX network service, but the problem is that the ‘2D Selection’ interface currently only expects resources in the second dimension.
- Close the graph and re-draw Service Allocated Operating Charge for the Voice service, but this time un-check 2D Selection.
Now you can choose from the specific service / resource pairs of results that are generated. You can also see the service / service pairs.
- Select all the available pairs and draw them on one graph.
- Draw the same chart for WiMAX network to get the breakdown between WiMAX access sector and Base station site.
There is a series on the first chart for the WiMAX capacity resource, even though it does not actually generate any cost. You could manually remove it from the chart, but if you are certain that it will only ever act as a ‘dummy’ resource, then it can be suppressed from the results altogether.
- Go back to the Editor and set the input Cost Breakdown = No for the WiMAX capacity resource (icon menu/Advanced/Financial Details).
- Re-run the model, and re-draw the original Service Allocated Operating Charge graph for the Voice service. You will find that WiMAX capacity no longer appears in the secondary selections.
You may decide that you want to present a fully detailed breakdown for Voice, alongside the layered approach above.
- Go back to the Editor and set the input Cost Breakdown = Transparent (Data menu/Other Details).
- Re-run the model, and re-draw the graph.
Now the results for Voice / WiMAX access sector and Voice / Base station site appear alongside Voice / WiMAX network.
- Show the graph as a separate table to verify that the relevant numbers add up as you expect!
This might look like a lot of work to consolidate two numbers into one, but remember that the WiMAX network might represent a whole cost model in itself. The WiMAX capacity resource could readily accept requirements from multiple services, and thus act as a capacity aggregator and replace the explicit addition made by the WiMAX access bandwidth transformation, were it not for the complication of the WiMAX prop transformation!
 Things that you should have seen and understood
Layered cost reporting, linear (non-2D) selection
Value Chain, Commodity, Cross Charge, Cost Breakdown (suppress element), Transparent