In the previous part of the tutorial, we calculated that a customer tariff of approximately EUR 3.00 per customer per month should be about the right level to balance the costs incurred in providing the business to customers. We will explore this further now.
- Switch back to the Editor and open the Tariffs dialog for Service 1 (right-click on Service 1 and select Tariffs).
- Click on the Rental Tariff field and enter a value of 3.
- Change Tariff Period to Month.
Note: the Rental Tariff is the amount paid per customer in a period. We could also have charged an initial Connection Tariff to connect a customer to the service, and a Usage Tariff to reflect ongoing usage (if we had defined the Traffic per Connection input), but for simplicity we will just charge the regular rental tariff.
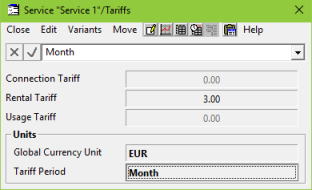
Figure 1: The service Tariffs dialog
- Run the model by pressing <F5>.
- Now look at the Revenue and Operating Charge per Average Connection graph.
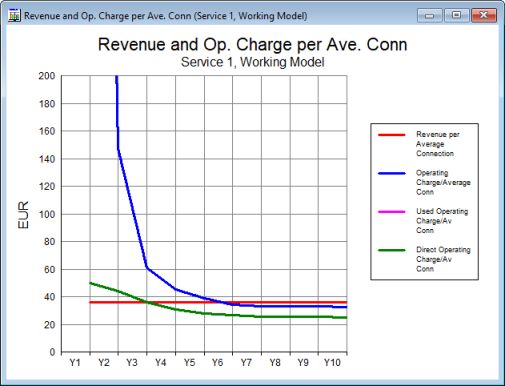
Figure 2: Revenue and Operating Charge per Average Connection graph, Rental Tariff = EUR 3.00/month
As you would expect, the Revenue per Average Connection is EUR 36.00 (12 × EUR 3.00). The Operating Charge/Average Connection (blue line) decreases from Y2 to Y5, and crosses the Revenue per Average Connection line during Y6, which is the point at which you would expect your business to become profitable.
Note: the green line (Direct Operating Charge/Average Connection) represents the cost per customer for resource that is actually being used (i.e., it does not include any unused capacity). Ideally, it would have the same value as the blue line, indicating no slack capacity.
- Now draw a Revenue graph for Service 1: select the Connections graph, select Draw Similar… and then Revenue in the Graphs tab, before pressing OK.
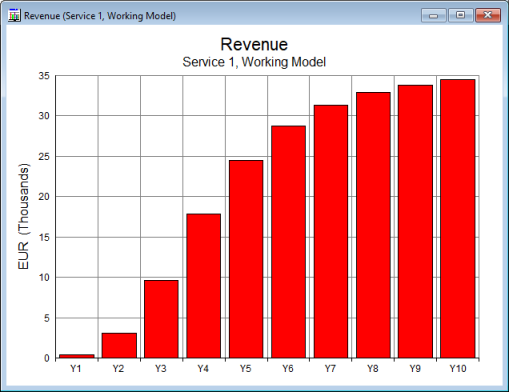
Figure 3: Revenue graph, Rental Tariff = EUR 3.00/month
Are these results that you would expect? At a revenue of EUR 36.00/customer/year, and approaching 1000 customers by the end of Y10, these results look plausible.
- Now draw graphs of Operating Profit and Operating Profit Margin for Service 1.
-
Change the y-axis for the Operating Profit Margin graph so that the minimum value is 0 (right-click on y-axis and select Format Axis…).
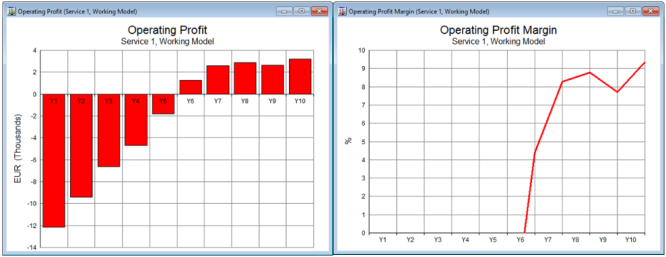
Figure 4: Operating Profit and Operating Profit Margin graphs, Rental Tariff = EUR 3.00/month
These graphs indicate that the business is profitable from Y6 onwards and that the profit margin is initially about 4%, increasing to over 9% by the end of Y10. However, the business required high initial capital expenditure, whereas the revenue only increased later. A successful business needs money at the right times to function successfully – we will explore business cashflow in more detail in the next part of this tutorial.
 Things that you should have seen and understood
Tariffs dialog, Rental Tariff
Revenue, Operating Profit, Operating Profit Margin