In this part of the tutorial, we are going to explore the resource element of the model. The resource is the element in STEM that corresponds to equipment, or the capability that allows you to deliver a service to your customers.
- Firstly, switch back to the Editor. Close any open dialogs and graphs (by clicking on the
 in the top-right of the dialog/graph window).
- Right-click on Resource 1 and select Capacity and Lifetime to access the Capacity and Lifetime dialog.
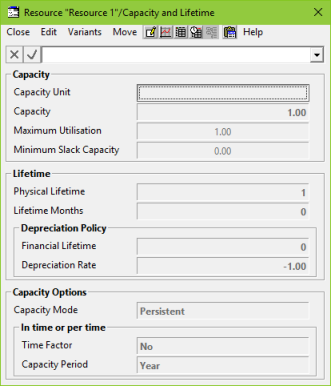
Figure 1: The resource Capacity and Lifetime dialog
We need to dimension the business assets that are actually required to deliver the service to customers, using the parameters set out earlier.
- Enter the following values:
Capacity Unit = Customers
Capacity = 50 (each unit of resource can provide the service to 50 customers)
Physical Lifetime = 5 years (each unit of resource will need replacing after 5 years)
We also need to enter some cost data in a separate Costs dialog.
- Access the Costs dialog by returning to the Resource 1 icon, right-clicking on it and selecting Costs (alternatively, go to the Move menu in the Capacity and Lifetime dialog and select Costs).
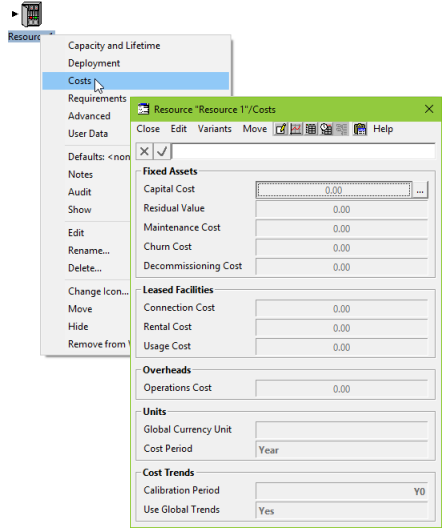
Figure 2: Accessing the resource Costs dialog
Here we will enter the Capital Cost (how much it costs to buy one unit of the resource initially) and the Maintenance Cost (how much it costs to maintain one unit of the resource each year).
- Enter 5000 in the Capital Cost field (select the field and type 5000) and then press <Enter>.
- Select the Maintenance Cost field and then left-click in the formula bar. We will express Maintenance Cost as a percentage of Capital Cost, defined by a formula.
- Use the mouse to left-click on the cell where the Capital Cost value is displayed; notice that the mouse cursor changes to a
 over this cell, indicating that you can pick up the reference text input.
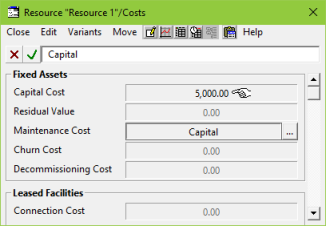
Figure 3: Picking up a reference to another cell
- The reference text Capital is added to the formula bar.
- Then type ‘*’ followed by 0.05, such that it now reads Capital*0.05.
- Press <Enter> or click
 to finish editing the formula. The completed formula is displayed in the formula bar and the corresponding value for Maintenance Cost (defined as 5% of Capital Cost) is calculated and displayed in red.
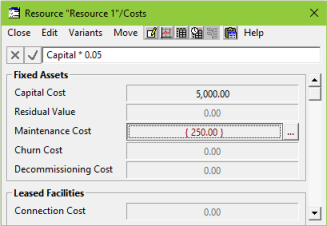
Figure 4: Formula calculating the Maintenance Cost as a proportion of Capital Cost
If you subsequently modify the Capital Cost input, the Maintenance Cost will be recalculated automatically to show 5% of the new value.
- Select the Global Currency Unit field and enter EUR to define the currency used.
- Close both the Costs dialog and the Capacity and Lifetime dialog.
Note: you can alter the Cost Period input if you want to enter a maintenance cost as a monthly or daily value instead of an annual value.
Note: if you hover with the mouse over an icon, a tooltip appears containing a summary of the data for that icon.
Now we need to make a connection between Service 1 and Resource 1, specifying that the customers require the capacity of the resource.
-
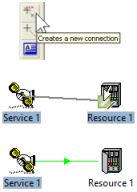 Left-click on the Connect tool on the toolbar. The cursor changes to match the image on the button.
- Left-click again on Service 1 and then move the cursor so that it is above Resource 1. You will notice a small green Quick Connect handle appear when the cursor is hovering above Resource 1.
- Left-click on the Quick Connect handle. A green connecting line (called a Requirement link) is drawn between Service 1 and Resource 1.
The Quick Connect handle allows you to specify directly, without prompting, that you would like one connection of the service to require one unit of resource capacity. As each unit of the resource has a capacity of 50 customers, once the number of customers exceeds 50, STEM will need to add another unit of resource with capacity for a further 50 customers. (Otherwise you would pick from a number of alternative service outputs such as Connections, Traffic or Revenue.)
- Press <F5> to run the model again.
We will explore the results in the next part of this tutorial demo.
 Things that you should have seen and understood
Service, Demand dialog
Customer Base, Penetration, Change Type, S-Curve
Run model, Results program
Drawing graphs, Show Graph as Table