Your existing graphs in the results program will have been updated with results for the working model only. We need to draw new graphs that will include the scenario results too.
- For the current NPV graph, double-click on the Working Model minor title (or right-click and select Change Scenario Selection…) to open the Change Selections dialog.
- The Change Selections dialog has essentially the same options as the Draw dialog, but you will notice that there is now an additional Scenarios tab, as scenarios have been run.
- In the Scenarios tab, select Variants 1, 2 and 3 and add them to the Selected list.
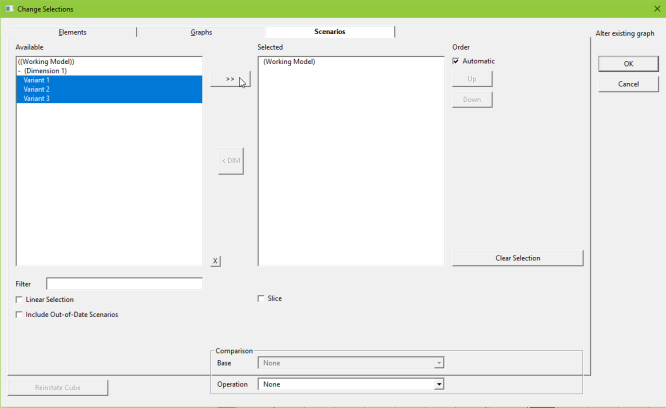
Figure 1: Selecting scenarios to include in a graph
- Press OK to draw the graph.
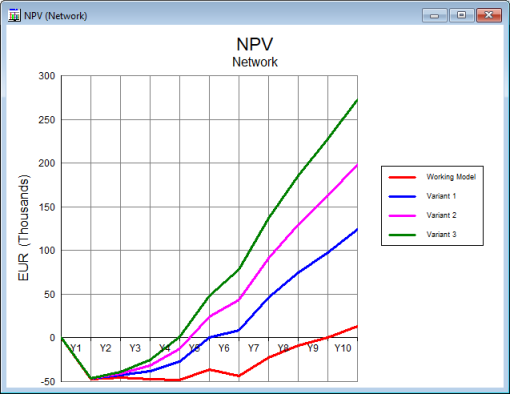
Figure 2: NPV graph showing scenario and working model results
Note: If you would prefer not to have the Working Model result on your graph, you either deselect it in the Change Selections dialog before drawing the graph, or remove it after drawing the graph by right-clicking on the working model line, selecting Remove Series… and then choosing Working Model in the Remove Series dialog.
You can see that with rental tariff values ranging from EUR 8.0 to EUR 12.0/month, the breakeven point is reached at the end of Y5 (Variant 1; EUR 8.0) to Y4 (Variant 3; EUR 12.0).
So, we now know that EUR 8.0 (Variant 1) gives you a breakeven point after 5 years, so we will change the values for Variants 2 and 3 to try to determine how much we need to charge to break even after 2 and 3 years.
- Change Variants 2 and 3 to Rental tariff = EUR 20.0 and EUR 30.0, respectively. Press <F5> to run the model (<F5> will run your previous selections, if any changes have been made).
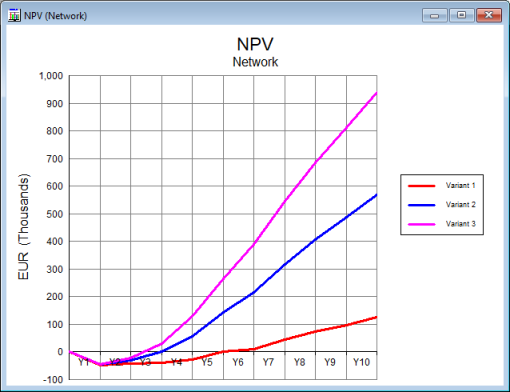
Figure 3: Updated NPV graph with different rental tariff values
You can see that a rental tariff of EUR 20.0 (Variant 2) gives you a breakeven point of 3 years.
- Keep Variant 2 as EUR 20.0 and then try different values for Variant 3 (e.g., 36/46/56) to determine what value will give a breakeven point of 2 years.
The graph below shows the answer to our original question: we need to charge customers a rental tariff of EUR 8.0 (Variant 1), EUR 20.0 (Variant 2) and EUR 56.0 (Variant 3) per month to break even in 5, 3 and 2 years, respectively.
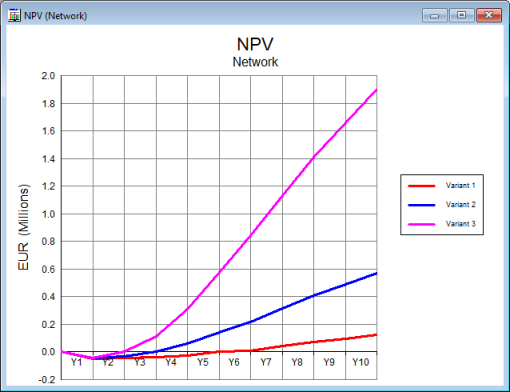
Figure 4: Breakeven point reached in Y2, Y3 and Y5 with rental tariffs of EUR 56.0, EUR 20.0 and EUR 8.0, respectively
Standard financial tables, such as Balance Sheet, Cashflow Statement, and Profit and Loss Statement, are available as ‘Pre-defined graphs’ in the Results tab of the Draw Graph dialog when Network is selected (or no elements) in the Elements tab. Another useful choice is Financial Indicators, which includes standard metrics such as Return on Capital Employed and Break-Even Point. The Snapshot option in the Format tab restricts a table to a single column for one period (the end of the model run by default) which makes for ready comparison when you include multiple scenarios in the output.
 STEM visual software for the reliable modelling of business
The STEM software makes it easy to structure a typical business problem and to harvest a wealth of standard technical and financial results, the underlying business logic for which has been validated over twenty years by a diverse user base across five continents. Not having to waste time on these calculations allows you to focus on the analytical exercise of using the model rather than the tedious and potentially error-prone task of coding and validating it yourself. The visual interface makes every step intuitive and visible in a team environment and the generated connections between elements make the model self-documenting as you go along.