STEM is designed so that a new user can quickly and easily build a basic model to calculate the resources required to meet a specified telecommunications demand and produce a set of key financial results.
As users become more experienced, they can take advantage of advanced features which enable them to build more complex models to study the inter-relationships of other factors which influence financial results. These factors include the allocation of common costs, cost-related tariffs, price elasticity of demand and value-chain modelling.
The STEM Editor provides an easy-to-use graphical interface for creating, copying and arranging icons which represent the elements which make up an operator’s business. Each element contains a data set which is entered into the model from a series of dialogs associated with individual model elements. The menus and data input dialogs have been designed to make a clear distinction between the essential and more advanced features.
Data which affects all the model as a whole, but is not directly associated with individual elements, such as the length of the model run and the financial position at the beginning of the model run, are entered as a global data set through separate dialogs.
Within a STEM model, data can be copied and pasted between input fields, model elements and even different models. Input data fields can also reference external files. Factors which affect the whole model, such as the length of the model run and the financial position at the beginning of the model run, are set globally. Figure 1 below shows a snapshot of the STEM Editor, displaying the elements of a simple model.
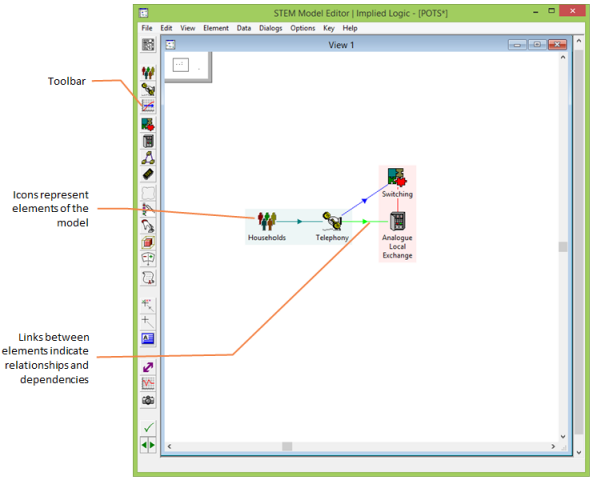
Figure 1: A snapshot of the STEM Editor
Elements are created using the buttons on the toolbar to the left of the model window or from the Element menu. As each element is created, the user gives it a unique name (or an option can be set so that elements are named automatically).
Data associated with each element can be entered and updated at any stage. Because elements can be copied along with their internal data, it is possible to produce a model very quickly that contains a number of similar elements.
Link lines between elements show relationships and dependencies. Data can be viewed for each individual element, for a multiple selection of elements, or as a table of all elements of the same type. There are a number of different ways to access the data dialogs associated with an element.
Dialogs display the data fields and their current values – field buttons inside the dialog indicate that there is another level of data below, containing time-series data. Figure 2 below shows a typical pop-up menu and dialog.
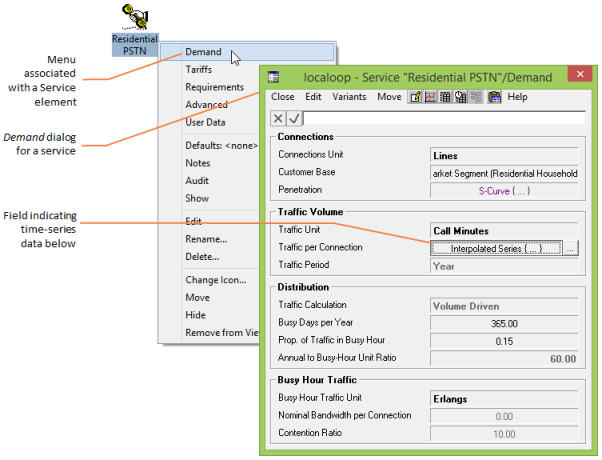
Figure 2: A typical element menu with the selected dialog
Data for similar elements can be viewed in a table by selecting Tables from the Data menu. Data can be compared, copied and pasted across fields within the table – see 4.15 Copying and pasting data.
Figure 3 shows a table of Resource element data for Costs.
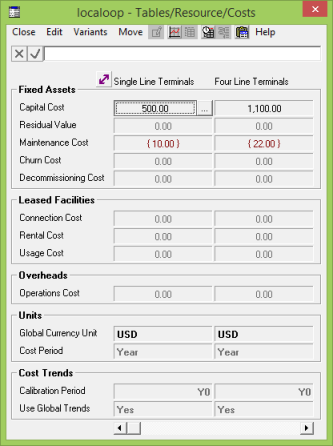
Figure 3: Data for elements of the same type viewed in a table
Many of the STEM input data items are time series, and you have considerable flexibility in how these are defined – including S-Curves and Exponential Growth curves. In addition, time series can be entered as a series of periods and corresponding values (Interpolated Series) – this is of particular interest if input data is being prepared using some other system, such as a spreadsheet.
You can immediately view the input data in graph format by invoking the Graph command from an input dialog.
STEM provides features which enable you to display a model in a number of different ways. This is particularly useful if you have built a large model containing lots of elements.
- The Editor represents relationships between model elements using different coloured link lines between the icons. These indicate dependencies or relationships between the particular elements. For example, Resources are always linked to a ‘parent’ Function using a red line (this is the default colour, which can be changed). Elements whose input data are linked to data from another element are joined by brown lines.
- In addition, the STEM Editor allows the user to manually draw link lines between any pair of icons. These user links have no meaning to the model itself, but can help the understanding of non-users. This is particularly advantageous when presenting models and their results to decision makers.
- To aid examination and understanding of a model, icons and links can be hidden in the display. In this way, views of models can be edited to include only those elements of immediate interest.
- The graphical representation of the model may extend to an effectively unlimited extent in any direction. To assist the user in navigating around large models, the Editor provides a reduced view of the entire model in the zoom window, showing the location of the current window in relation to the model as a whole; dragging the rectangle within the zoom window allows you to adjust the view shown in the current window.
- It is also possible to create multiple views of the same model, which again may help understanding.