It is also possible to export data from results graphs
to Excel. As for model input data, the results data can be linked dynamically so that inputs defined in Excel link through to the model, and results shown in Excel can be updated directly.
From the Results program you can create an Excel workbook containing all the data from a specific chart, or from all the charts in the current view, or from selected views in the current workspace. The graph selection interface is used as the wizard element for pre-selecting the data to send to Excel.
-
In the Results program, either draw graphs showing the data you wish to export, or open a view with the results charts that you want.
-
Select Export Results from the File menu. The following dialog is displayed:
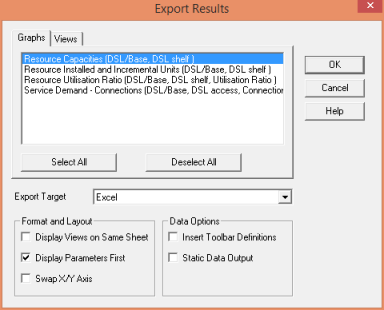
- Select the required chart(s).
- Select Excel from the Export Target drop-down menu and Display Parameters First from the Format and Layout menu
-
Click OK. The status bar at the bottom of the screen shows the progress of the export process, and when this is completed the resulting Excel workbook is displayed, with the same name as the model, containing a new Results worksheet.
Note: Consolidation for all charts has been set to Year in these examples
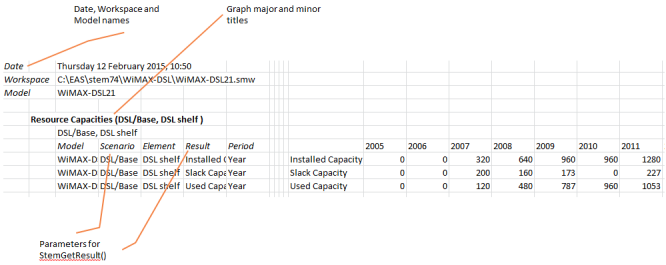
At the top of the Results worksheet you will see the Date of export, and the names of the Workspace and the Model.
For each graph there is a block of data which includes the following:
- the name of the graph (in bold)
- the names of the scenarios/elements/results common to all lines on the graph
Below this there is a block of information with five columns that precisely identify the source data for the chart:
-
the name of the model (WiMAX-DSL in this example)
-
the name of the scenario (DSL/Base in this example)
-
the name of the element (DSL shelf in this example)
-
the name of the result (e.g., Installed/Slack/Used Capacity)
-
the relevant Consolidation period (Year in this example).
Note: selecting Display Parameters First in the Export Model Data dialog means that these parameters are displayed first in the worksheet – otherwise they would be displayed after the results data itself.
To the right there is another block of information containing:
- the labels of the data series
- the data itself.
Each time you export results from specific charts, these are added to a new sheet named ‘Results 1’, ‘Results 2’ and so on. If you are exporting an entire view (selected using the Views tab on the dialog), all the data from that view is written to a single worksheet with the same name as the view.
Note: You must close the results workbook in Excel before carrying out additional exports.
The generated Excel worksheets link their data dynamically from STEM (using the STEM add-in toolbar for Excel) so that they can be updated automatically after you re-run the underlying model.
Export options
When you are exporting results, the dialog offers a number of options which determine the content and layout of the resulting worksheets:
-
Display Views on Same Sheet: if multiple views are selected for export, they will be included on the same worksheet.
-
Display Parameters First: parameters will be displayed before the results data
-
Swap X/Y Axis: present years vertically rather than horizontally.
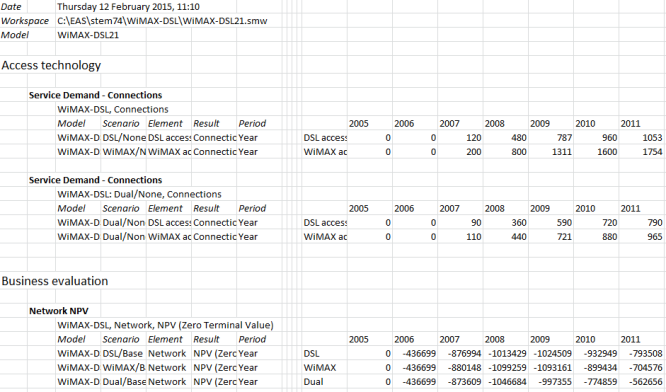
Two views (Access technology and Business Evaluation) displayed in the same worksheet)
-
Insert Toolbar Definitions: you can ask STEM to include a toolbar definition during the export. The toolbar definition will be pasted into a new worksheet. The role of this STEM add-in toolbar definitions sheet is described in full in 6.5.2 Configuring the STEM add-in custom toolbar.
-
Static Data Output: as mentioned above, the data sheets are by default dynamically linked to STEM using the StemGetResults() function. However, if you select the Static Data Output option, STEM will generate a flat sheet of data that is not linked back to the model.