The process of creating sensitivities is very similar to creating scenarios (see 9.3.1 Creating scenarios for a single input), or creating templates for template replication (see 9.5 Managing complexity with template replication): they can be added directly from any data dialog, using the Variants menu. For example, to vary the penetration of a service:
-
Display the Demand dialog for the Service and enter a Customer Base input of
1,000,000.
-
Define the Penetration as an S-Curve with Saturation = 1.0
and with Y1 value = 0.02 and Y2 value = 0.07.
-
With the Penetration time-series field still selected, go to the Variants menu and select Add as Sensitivity Parameter…. A new sensitivity element
Sensitivity 1 is created, with Penetration already set up as the first parameter to be varied. By default, the parameter will be varied up and down by 1% of its value in a single step in each direction. In the original dialog, the Penetration field is now shaded light pink, showing that it is subject to a sensitivity test.
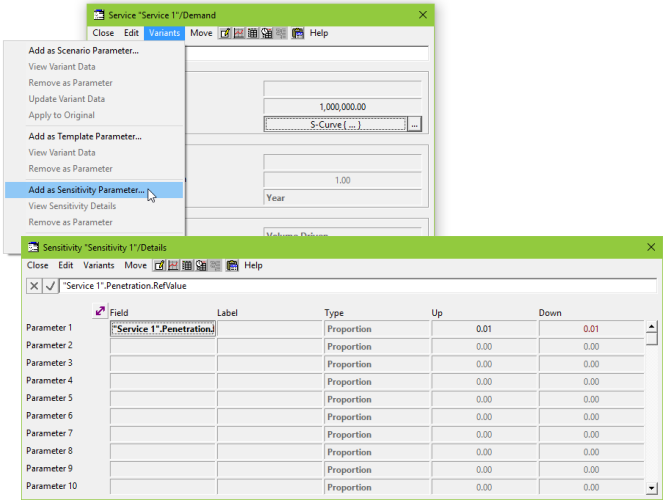
Figure 1: Creating a new sensitivity
Note: changing the number of sensitivity steps to 2 does not double the maximum range. The number of steps is intended as a measure of detail, whereas the Up and Down values are intended as the overall limit independent of the number of steps.
You are now ready to see how sensitive the model is to variation in the Penetration assumptions. However, because sensitivity analysis can generate significant amounts of results data, STEM does
not
run any sensitivities unless you explicitly instruct it to do so. In order to see the results, therefore, proceed as follows:
- Select Scenarios and Sensitivities… from the File menu. The Scenarios and Sensitivities dialog is displayed.
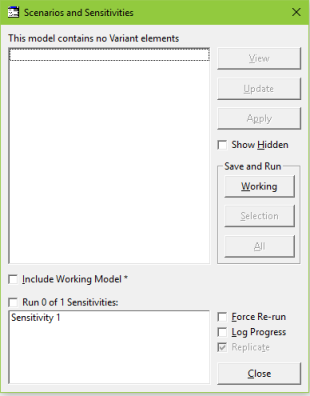
Figure 2: Selecting a sensitivity to run
- Choose Sensitivity 1
from the list. The caption of the check box above the list box changes to say “Run 1 of 1 Sensitivities”. If the model had scenarios, you could also specify which scenario(s) to run (and you can include or exclude the working model, as usual). Click on the Working button. The working model is run, generating the desired sets of results.
- In the Results program, select Draw from the Graphs menu. The Draw dialog opens.
-
In the Elements tab, select the element of interest (e.g., Service 1) and add it to the Selected list.
-
Move to the Graphs tab and select the graph you want to draw (e.g., Connections).
-
Enter the Sensitivities tab, which will only be shown in the Graphs dialog when you have run a sensitivity. Select the sensitivity you want to show on a graph (e.g., Sensitivity 1) and add it to the Selected list. If you don’t select a sensitivity, then the results for the working model only will be drawn.
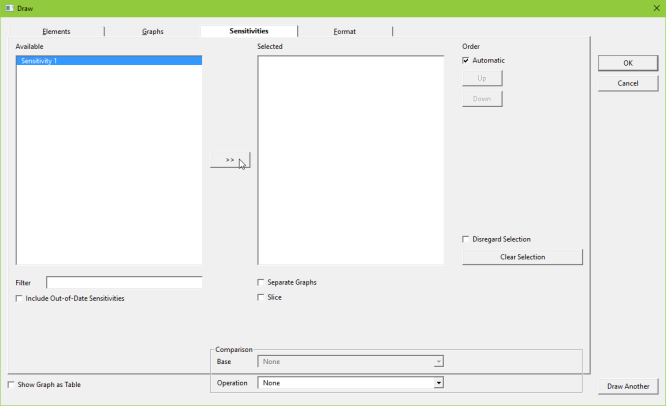
Figure 3: Selecting a sensitivity to draw on a graph
- By default, sensitivity graphs will be drawn as tornado graphs (see 9.4.6 Drawing tornado charts of sensitivity results). In this example, it will be more straightforward to show the results as a time-series graph, so enter the Format tab and select Time Series in the Basis section. Press OK to draw the graph.
-
A graph of service Connections over time is displayed with three lines: for the base case and each of the two sensitivities, up (+1) and down (–1).
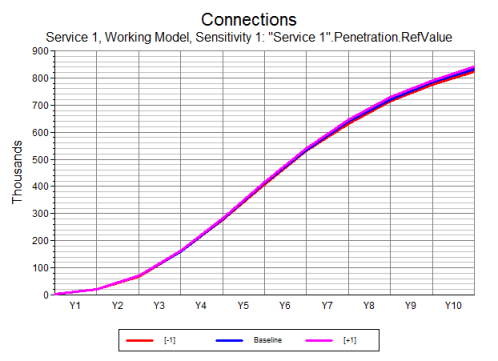
Figure 4: Time-series graph showing a single set of sensitivities
See also 5.6 Selecting sensitivities; drawing snapshot and tornado charts.