One of the biggest uncertainties in a STEM model is how demand for a service will grow in the future. Suppose you have a service with 100 connections, for which the probable Penetration is around the 10% mark. First of all, enter these values:
-
Select Demand from the service icon menu. The Demand dialog is displayed.
-
Left-click with the mouse to select the Customer Base button.
-
Enter 100 on the button and press <Tab>. The button shows
100.0, and the focus moves to the Penetration field.
-
Enter 0.1 on the button and press <Enter>. The button shows
0.10.
Creating dimension and variant elements
In order to see how the results depend on the value of the Penetration, it would be interesting to enter some alternative values for the Penetration. STEM uses dimension and variant elements to identify scenario parameters and the corresponding scenario data. You can create these from the toolbar as usual:
-
Click the
Dimension button
 on the toolbar or press <Ctrl+Shift+D> to create a new dimension element. STEM will prompt for the name of this element if Automatic Names is not checked in the main Options menu.
-
Enter the name Demand
and press <Enter>, selecting Rename from the icon menu if necessary.
-
 Click the Variant button on the toolbar or press <Ctrl+Shift+V> to create three new variant elements, with the names
Pessimistic, Probable and Optimistic.
Click the Variant button on the toolbar or press <Ctrl+Shift+V> to create three new variant elements, with the names
Pessimistic, Probable and Optimistic.
Note: In fact, STEM will automatically create a dimension if there are none when you first click the Variant button on the toolbar. In general, new variants will be associated with the current dimension, if one can be inferred from the selection in the current view; otherwise STEM will display the Choose Dimension for New Variant dialog to prompt for the name of an existing dimension, or the option to create a new one.
Identifying a parameter for a dimension
-
Now select Add as Scenario Parameter… from the Variants menu on the Demand dialog. The Choose Dimension for New Parameter dialog is displayed, with the choice of an existing dimension or a new one.
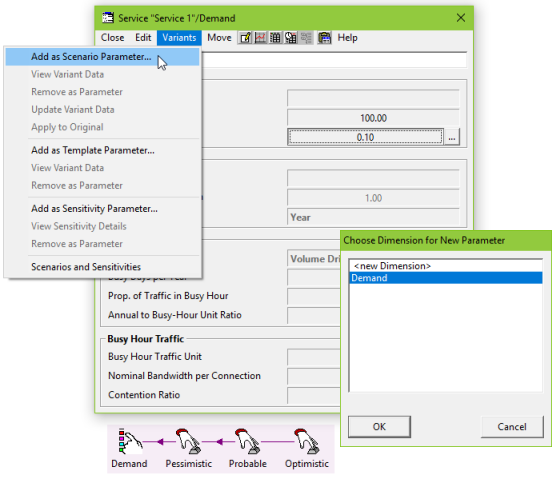
Figure 1: Creating scenarios for a single input
-
Select
Demand and click OK. The Variant Data dialog for the
Demand
dimension is displayed: a tabular dialog with rows for scenario parameters and one column for each of the new variants. The first parameter is automatically identified as the service Penetration field, and the original value of 0.1 is copied into the first field for each variant. By default, the field in the first column is selected.
Note: If you prefer, you can select Add as Scenario Parameter… from the Variants menu before you have created any dimension or variant elements. STEM will automatically create a new dimension and several variants if there were none before.
Entering scenario data
-
Enter a new value, say 0.07, for the Pessimistic variant.
-
The alternative values for the service Penetration do not need to have the same type, so, for example, you could set the
Optimistic
variant to be an Exponential Growth with Base = 0.1 and Multiplier = 1.08, representing 8% annual growth compared to the
Probable
variant.
Viewing scenario data
-
Select View Original from the Variants menu in the Variant Data dialog to return to the service Demand dialog. Note that the Penetration field is now shaded pink to indicate that it is a scenario parameter. If you pull down the Variants menu in the Demand dialog, you will see that the Add as Scenario Parameter… item can no longer be selected, but you can select the View Variant Data… option instead; this jumps from any scenario parameter to the first column of the corresponding row in the Variant Data dialog.
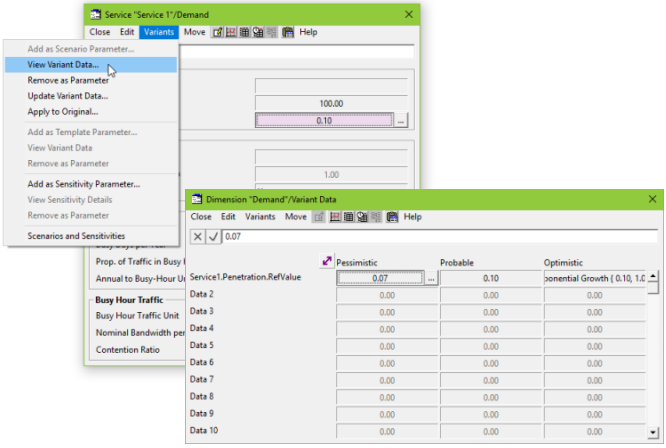
Figure 2: Viewing variant data for service Penetration
-
Close the service Demand and Variant Data dialogs. You will see that a purple scenario link runs from the Demand dimension icon to the Service 1 icon, indicating the logical flow of data.
Note: You can also double-click on a scenario link from a variant to a dimension to view its variant data, or from a dimension to a dependent element to view a scenario parameter. The Editor will prompt for which parameter if the element contains more than one scenario parameter in that dimension.
If the default choices of colours for scenario parameters and links are not to your taste, you can easily change them:
-
Select Colours… from the Options menu on the main window. The Choose Colours dialog is displayed, showing the current colours for values in data dialogs which are affected by formulae, linked defaults or scenario parameters – see 4.14.8 Colours for linked defaults.
-
Right-click on a scenario link to show the link menu, and then select Format…. The Format Scenario Links dialog is displayed – see 4.18.2 Changing the drawing attributes for a type of link.
Running scenarios from the Editor
Now that you have entered some alternative values for the Penetration, you will be keen to see how the results depend on these values. STEM will run some or all of the defined scenarios at a single command:
-
Select Scenarios and Sensitivities… from the File menu on the main window. The Scenarios and Sensitivities dialog is displayed for the model, with the three variants listed under the heading
Demand. There are three buttons under the heading Save and Run. The first button, labelled Working, runs the basic model, using the actual values in the main data dialogs, and is equivalent to selecting Save and Run from the File menu.
Note: You can also access the Scenarios and Sensitivities dialog by selecting Scenarios and Sensitivities from the Variants menu on a normal data dialog or a Variant Data dialog.
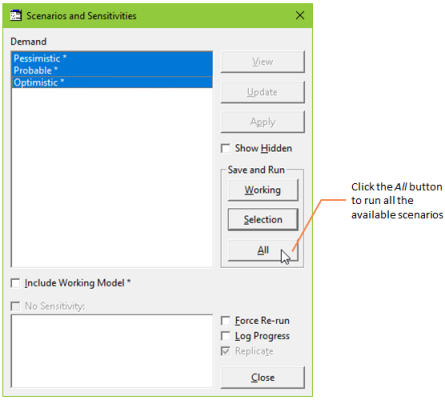
Figure 3: Running scenarios
-
When the number of defined scenarios is greater, you can use the Selection button to run selected scenarios from the list; but for now, simply click the All button to run all three scenarios. The model is first saved, and you will see that the button heading changes from Save and Run to just Run. The alternative data are then applied in turn to generate the three scenarios, which are then checked, run and sorted as normal.
Note: once a choice has been selected from the Scenarios menu, pressing <F5> will repeat your last command (e.g., if All was selected initially, pressing <F5> will run all scenarios the next time).
Comparing scenarios in the Results program
When a model and/or some or all of its scenarios have been run, the results are automatically loaded into the Results program. Although only the basic model name appears in the caption, when you come to draw a graph you will find that all the scenarios which have been run are available for comparison:
-
Select Draw… from the Graphs menu in the Results program. The Draw dialog is displayed, with a list of Available elements.
-
Select the element of interest (in this case, Service 1), and double-click to add it to the Selected list (or select it and press
 ).
).
-
Move to the Graphs tab, where a list of pre-defined graphs is shown. Select Connections.
-
Move to the Scenarios tab. If Linear Selection* is checked, then the three scenarios, Pessimistic, Probable and Optimistic are listed linearly in the Available box. Select all three scenarios and add them to the Selected box.
*Note: see Linear selection for more detailed information on linear selection.
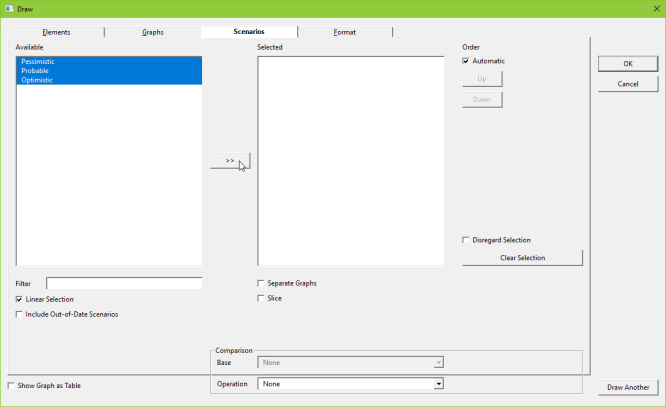
Figure 4: Choosing scenarios in the Results program
-
Press OK to draw the graph: a Connections graph for Service 1 is displayed, with one line for each scenario. The individual scenario names are shown in the legend.
Note: If you have also run the working model, it is listed as ‘Working Model’ in the Scenarios tab. By default, only up-to-date scenarios are shown in the Available list; you can check the Include Out-of-Date Scenarios box if you want out-of-date scenarios to be listed too. If you don’t select any scenarios from the list, then the results for the working model will be drawn on the resulting graph.
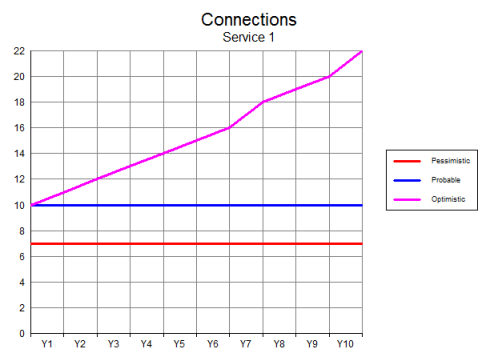
Figure 5: Comparing scenarios in the Results program
Note: If you select Open Results… from the File menu to open these results at a later date, you simply select the basic model name. STEM automatically loads all the available scenario results for the model.