Watch the video presentation and/or read the full text below
In all the earlier exercises, we have just ‘run the model’
(File/Run or <F5>). Now we have added these variants
for the tariff input, we need to be more specific:
-
Select Scenarios and Sensitivities on the
File menu (after Run).
The Scenarios and Sensitivities dialog is displayed,
with a prominent list of the scenarios defined for the model. Below
Low,
Medium and
High in the list, there is a checkbox labelled
Include Working Model which allows
for the model to be run with the current value displayed in the
Tariffs dialog. This is currently still
60.0, but may be varied independently of the
Variant Data. (The
Working Model is like a separate, default scenario.)
-
Check Include Working Model (so our existing results will remain
up to date), and then click All under
Save and Run (or you can first select all the scenarios in the list,
and the click Selection under the same heading).
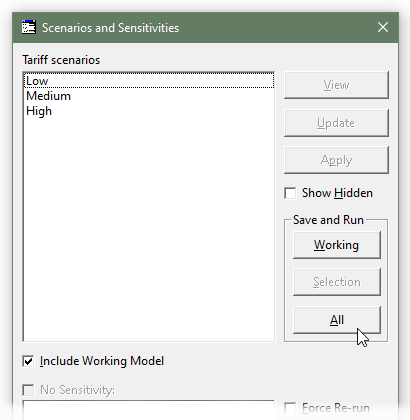
Figure 53: Running all scenarios, including the working model
The model is run four times in parallel (once for each scenario, with the new values
80.0/100.0/120.0 plugged in, plus the working model at
60.0). If you are quick, you will see some fleeting messages
in the status bar at the bottom left of the Editor.
The Results program is activated, and the graphs are updated, but nothing appears
to have changed! All of the existing graphs relate to the working model (which was
all we could graph before), and we have not changed the working value in the
Tariffs dialog.
Now we will modify the NPV graph to show the different
scenario results instead:
-
Double-click where it says Working Model on the
NPV graph. The
Change Selections dialog is displayed with an extra
Scenariostab listing the available scenarios.
-
Double click each of
Low,
Medium and
High to add them to the
Selected list (or click and drag to select them
all and then click the
 button).
-
Double click Working Model in the
Selected list to remove it (or click to select
it and then click the
 button).
-
Click OK. The graph is redrawn with
three lines, one for each scenario.
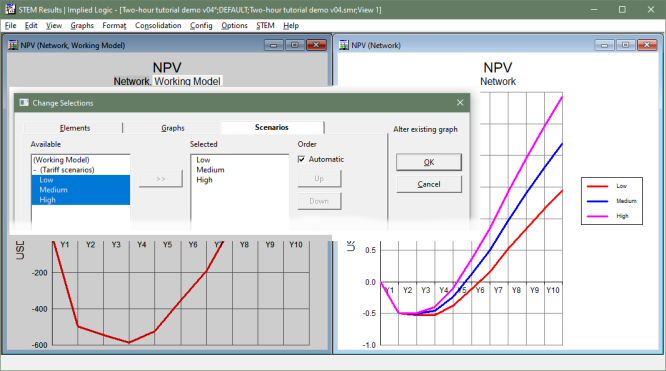
Figure 54: Changing the NPV graph to show
Low,
Medium and
High instead of the
Working Model
Our choices were not aggressive enough to achieve the desired results, but the spread
on the graph makes it much easier to assess what values we might need. For payback
at the end of Y5, it looks like we need a value between the current
Medium and High, say
90.0. For Y4, it needs to be slightly more than the current
High, perhaps 125.0, whereas for
Y3 we will still have to guess at something like 150.0. Try it!
-
Enter the new values 90.0/125.0/150.0 for
Low/Medium/High in the
Variant Data dialog in the Editor. (You can access
this directly from the Tariff scenarios icon.)
-
You can still just press <F5> to re-run the model. All the scenarios
that were run last time will be run again. The Results program is activated, and
the graphs are updated.
-
Repeat this process until the lines on the NPV
graph cross the axis as desired.
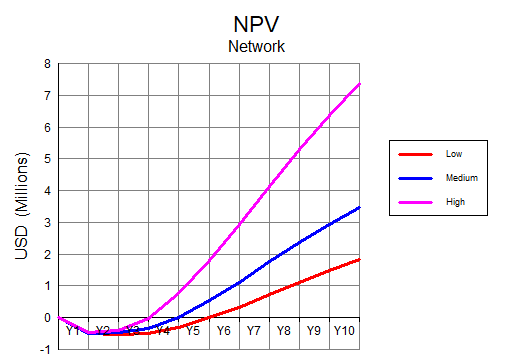
Figure 55: The business achieves payback in Y5/Y4/Y3 in the
Low/Medium/High scenarios
 Things that you should have seen and understood
Scenarios and Sensitivities, Include Working Model, Run Selection, Run All
Scenarios tab, Working Model