Watch the video presentation and/or read the full text below
Customers connect to use a network (more generally, a business function), and their
use can be measured in two different ways, namely the Traffic
Volume and Busy Hour Traffic.
These results correspond to the cumulative volume of traffic carried (or work done)
in a period, and the fastest, instantaneous rate at which the network must carry
that traffic (or do that work). Please review the relevant service inputs, as described
in Exercise 3.
In this simple exercise, we are concerned only with the
Busy Hour Traffic, and ‘how fast the
Uplink needs to go’. We will revert to the service,
because the other resources have no awareness of the traffic. We will learn how to
create a requirement for the Uplink on a basis other than
Connections:
-
Press <Ctrl+Q>, and then click the service to start the ‘connection’.
-
This time, avoid the quick-link target which appears when you hover
over the Uplink resource, and instead click somewhere
else on the background of the icon. A prompt appears to choose the service
Basis for the requirement, with numerous options
as illustrated below.
-
Select Busy Hour Traffic and click OK
(or press <Enter>). The other options are beyond the scope of
this tutorial. The service is linked to the resource. This is still a requirement link,
but the thicker green arrow highlights the non-default basis.
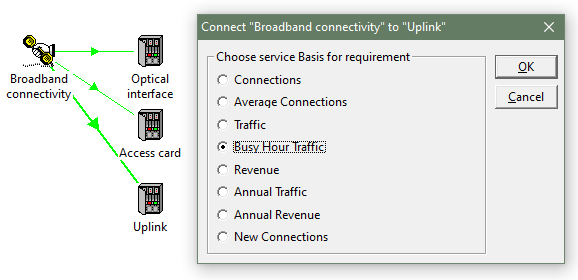
Figure 36: The thick green arrow indicates a requirement on the basis of
Busy Hour Traffic (non-default)
This option signifies that each unit of busy-hour traffic requires
one unit of capacity of the resource.
One might expect the distribution of traffic to be somehow linked to the simulated
distribution of customers between sites. However, there will be an independent variation
in traffic between customers too. At this level of detail, there is no justification
for any more subtle approach than just simulating the traffic distribution independently.
With more time, and sufficient data, the option remains to model the sites individually
as alluded to at the end of Exercise 14 above.
-
Connect the location to the Uplink resource.
-
Double-click the location link and set
Distribution = Extended Monte Carlo.
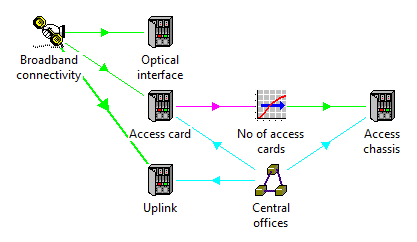
Figure 37: The four principal, connectivity resources are now all linked directly
or indirectly from the service
 Things that you should have seen and understood
Choose service basis for requirement