Watch the video presentation and/or read the full text below
Now we are ready to review the results for the Uplink
resource:
-
Run the model again. (There should not be any warnings at this stage!)
The Results program is activated.
-
As we have done before, change selections for the existing
Capacities and
Utilisation Ratio graphs to show the
Uplink instead of the
Access chassis.
-
Add Uplink to the stacked
Capital Expenditure and
Operating Costs graphs, and also to the table of
Installed Units.
-
If you need to redraw any of these, you can simplify the element selection
by filtering the available elements to Type =
Resources in the Draw dialog.
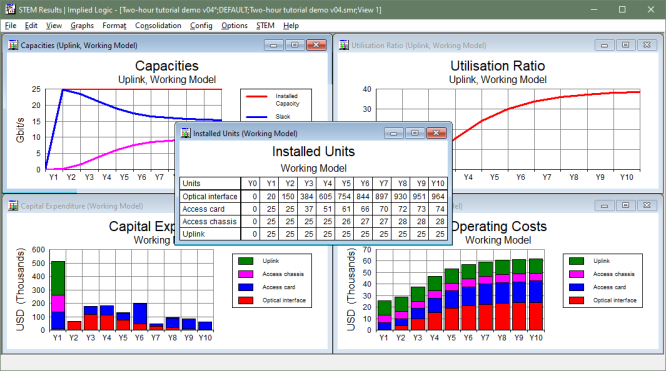
Figure 38: One Uplink resource per site is sufficient
throughout on the current assumptions
From the Capacities graph, it is clear that the
demand is not quite 10 Gbit/s, even at the end of the run period, and this is less
than half the installed capacity, as reflected in the
Utilisation Ratio remaining below 40%. This is not
sufficient for the simulation to trigger any extra units, so the
Installed Units remains at 25 throughout; i.e., one per site.
If your results don’t match those shown above, then flick back through the
other exercises and see if you can pick up where your results first differed from
those shown here.
Now we have a complete inventory of the principal fixed assets. In the next two
sections, we are going to add some overhead costs, before establishing a viable
pricing point for the service.
 Things that you should have seen and understood
Filter available elements by type in the Draw dialog