These new tools give you much more control over transition, as you can drive transition either as a percentage of starting demand (Relative Profile) or as an absolute number of customers transferring each year (Absolute Profile).
Annual Proportion
When the Churn Mode input is set to Annual Proportion, which is the new default setting, you will now get as near as possible the same results for a model regardless of whether it is running in years, quarters or months. For the example shown in Figure 4 in 1.6.1.1 Original implementation prior to STEM 7.5, 50% of current demand is transferred to Resource 2 each year, even if the model is running in quarters or months.

Figure 1: Results are now the same when the model is run in years, quarters or months
Although the annual proportion option is very useful if you want an exponential migration from Resource 1 to Resource 2, you may want a straight-line migration or some other more specific trajectory instead. The new Relative Profile and Absolute Profile options allow you to be very prescriptive about what the migration should look like.
Relative Profile
If you set the new input Churn Mode = Relative Profile, you can determine how you want the migration to occur. For example, you can use a straight-line time-series to model a straight-line transition: if you enter the values shown in Figure 2 below then 50% of the initial demand present in the Base Period = Y2 will be transferred from Resource 1 to Resource 2 each year (if Increment Period = Year) from Y3 onwards, such that the transition takes place over two years in Y3 and Y4.
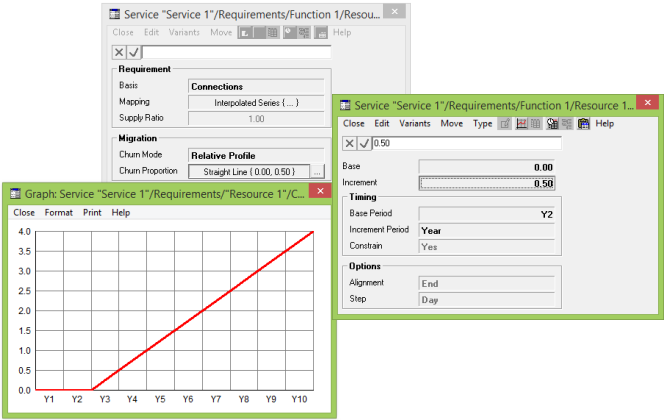
Figure 2: Modelling transition using Churn Mode = Relative Profile
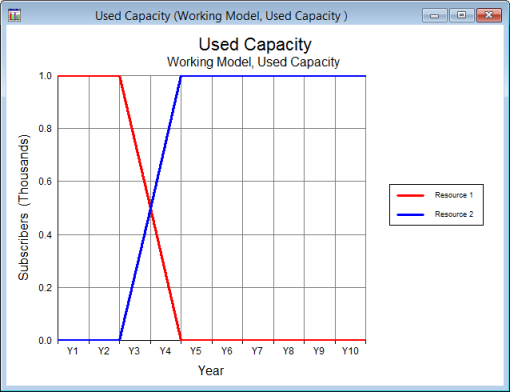
Figure 3: Transition from Resource 1 to Resource 2 in Y3 and Y4 with Churn Mode = Relative Profile
Absolute Profile
The new input Churn Mode = Absolute Profile allows you to determine a specific number of customers (for example) to be transferred from Resource 1 to Resource 2 in a given period. If you enter the values shown in Figure 4 below, then 200 customers will transition each year (if Increment Period = Year) from the end of Y2 onwards.

Figure 4: Modelling transition using Churn Mode = Absolute Profile
The Used Capacity graph for Resources 1 and 2 in Figure 5 shows that 200 customers move from Resource 1 to Resource 2 each year, such that the overall transition takes five years to complete.
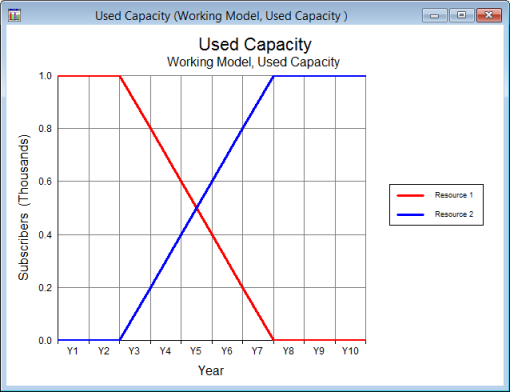
Figure 5: Transition from Resource 1 to Resource 2 at a specified absolute rate of 200 customers a year