In previous versions of STEM, sensitivities were shown in the same dialog as scenarios, as they are in the Editor, the inference being that they are additive to the scenarios selected to run or draw. In STEM 7.5, consistent with the new-look interface, sensitivities are shown in a separate Sensitivities tab in the Draw dialog, but the effect is still additive.
The following steps describe how to select and draw a graph showing sensitivities. As for other tabs, the Sensitivities tab will only be displayed if any sensitivities in the model have been run from the Editor, unless the Include Out-of-Date sensitivities option has been checked:
- Select Draw… from the Graphs menu. The Draw dialog is displayed.
- Select the element you want to draw in the Elements tab (e.g., Network).
- Select the graph you want to draw in the Graphs tab (e.g., NPV).
- Select the scenarios, if any, you want to include in the Scenarios tab (none selected in this example, so the results for the Working Model will be shown).
- Switch to the Sensitivities tab and add the sensitivities of interest to the Selected list (e.g., Sensitivity 1).
- Press OK to draw the graph. A graph showing the sensitivities for the selected element(s) is drawn.
Note: in STEM 7.5, graphs for sensitivities are drawn as Tornado charts by default. You can go to the Format tab and select a different Basis (i.e., Snapshot or Time Series) if you prefer.
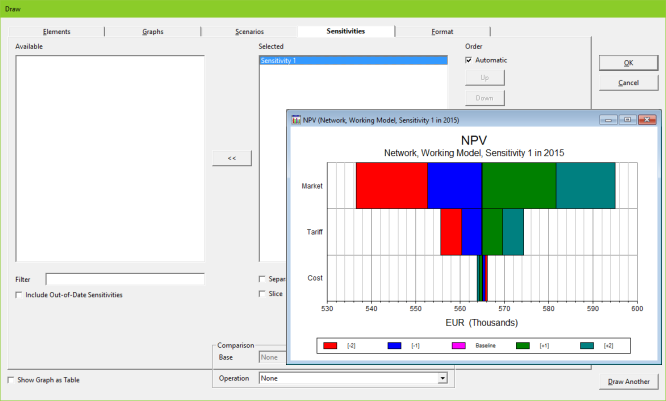
Selection of sensitivity to draw in Sensitivities tab and resulting graph
If no sensitivities are selected then just the results for the working model or selected scenarios are shown. Otherwise, each scenario is expanded with the selected sensitivities.
As in the other tabs, you can select the Separate Graphs option if you want a separate graph for each sensitivity element. All the steps for a single sensitivity will always be drawn on the same graph.
As in other tabs, if you select the Slice option, you will be able to switch between shortlisted sensitivities using a drop-down menu on your graph.