In STEM 7.4, the results selection interface could be accessed either through the Draw… command, where you could select from a list of pre-defined graphs, thereby saving time for common results combinations such as Installed and Incremental Units, or through the Draw New… command, where you could create graphs from a comprehensive selection of results.
In STEM 7.5, there is a single Draw… command, which has been explained in detail in sections 5.2.1 Element-selection interface for graphs, with filtering to 5.2.3 Dimensional selection of scenarios. Initially, the Graphs tab is shown in the Draw dialog, from which you can select from a list of pre-defined graphs. If you prefer, you can access the custom Results tab by pressing the Individual Results button in the Graphs tab. (In reverse, you can switch from the Results tab to the Graphs tab at any time by pressing the equivalent Pre-defined Graphs button on the Results tab.)
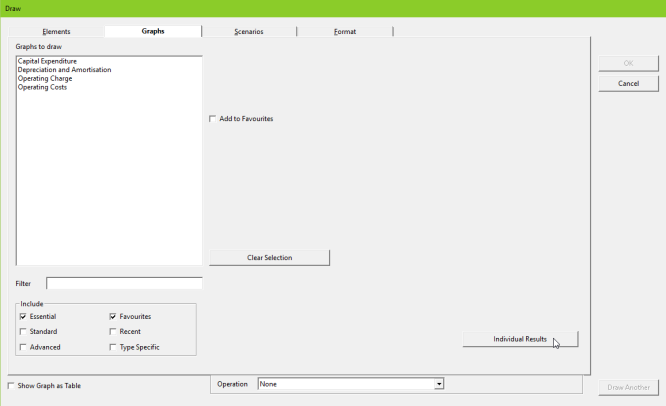
Figure 1: Accessing the custom Results tab using the Individual Results button in the Graphs tab
In the Results tab, the results listed as Available are limited by default to those that are available to all of the elements selected in the Elements tab. So, if you selected elements of different types, such as service and resource elements, results such as Operating Charge which are common to both types are listed as Available, whereas results such as Revenue and Installed Units, which are specific to services and resources, respectively, are not shown.
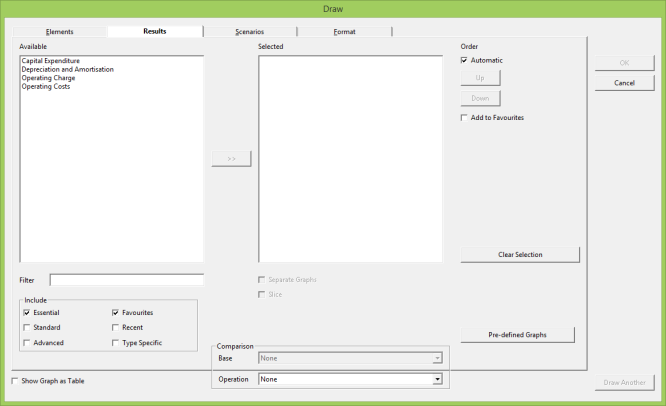
Figure 2: The Results tab, showing Available results for both service and resource elements
Similar to the Graphs tab, the list of Available results can be narrowed using a filter or by selecting Essential/Standard/Advanced/Favourites/Type Specific in the Include box (see 5.2.2 Focused and customised selection of predefined graphs for a more detailed explanation). Checking Type Specific in the Include box adds any results that are only available for a particular element type to the Available list: for example, Revenue for a service, even if one or more resources have been selected in the Elements tab.
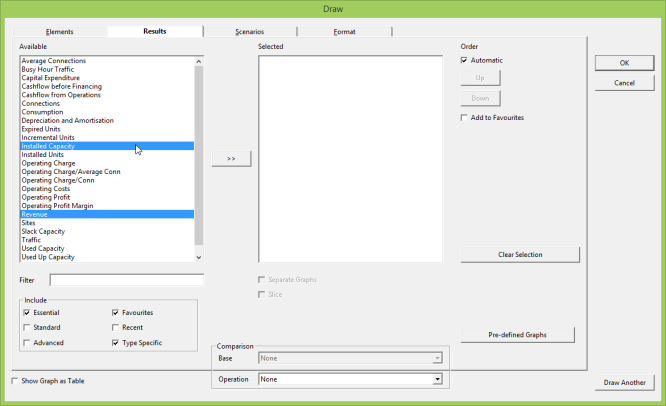
Figure 3: Selection of type-specific results in the Available list after Type Specific option checked
There are about 45 Essential results; these are the results you will need most of the time and which can be selected easily without scrolling if other categories are turned off. More than half of the Essential results are available for the network, whereas most element types have fewer than 15 (and some have significantly fewer still). In approximate terms, there are then 250 Standard results and a further 170 Advanced results. You may choose to ‘favourite’ a few of these (by clicking Add to Favourites) to avoid having to browse through the other categories all of the time (as long as the Favourites option is selected in the Include box).
Results can be moved to the Selected list individually, or via multiple selection, just like in the Elements tab.
As in the Elements tab, the Separate Graphs option is unchecked by default.
If there are no scenarios in your model, or if you press OK without selecting any, then you will just get results for the working model. The results selected are drawn on the same graph (unless you have selected the Separate Graphs option). So, for example, if you select Revenue for a service element (DSL access), and Operating Charge for both service and resource elements, both results are drawn on the same graph.
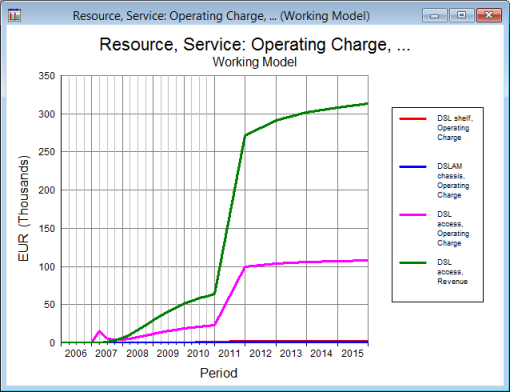
Figure 4: Graph showing service Revenue, and service and resource Operating Charge results