Watch the video presentation and/or read the full text below
Let’s review some of the existing results (or redraw them if necessary):
-
The stacked graph of Operating Costs
for all six resources shows that the annual total approaches USD 90 000 as
the number of customers approaches 1000, from which a per-customer share of c. USD
90 can be inferred.
-
There is also Capital Expenditure
for the first four resources, but for an annualised perspective, we need to draw
(similar) Depreciation and Amortisation. This tips
past USD 160 000 in Y10, c. USD 160 per customer, making an annual total of
c. USD 250.
-
It is instructive, but of course it is not necessary to do the arithmetic.
Another graph, Operating Charge, shows the combined
opex + depreciation. Try it!
-
Also, the same results can be drawn for the service directly (as an
allocated total).
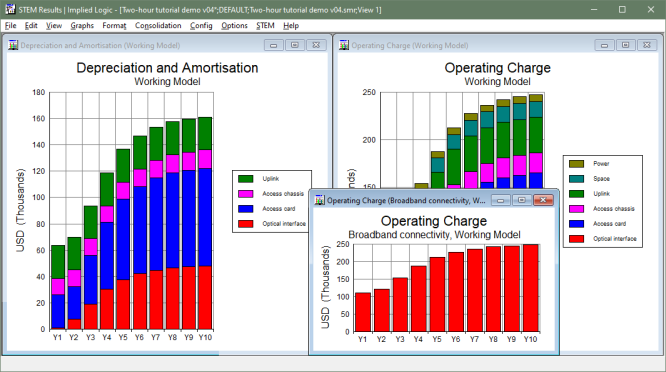
Figure 45: Operating Charge (opex + depreciation)
amounts to an annual total of c. USD 250 per customer
In fact, we can read-out this result directly from another, important graph:
-
Draw the graph Revenue and Op. Charge per Ave. Conn
for the service. The fully-allocated cost per customer is very large in Y1 when
there are few customers, so it is helpful to change the scale in order to focus
on the results from Y2 onwards.
-
Right-click the (value) y-axis and select
Format Axis from the context menu. The
Format Value Axis dialog is displayed.
-
Set Maximum = 2000 and click
OK. The graph is redrawn at an amended scale.
-
It may helpful to show a separate table to check the numbers.
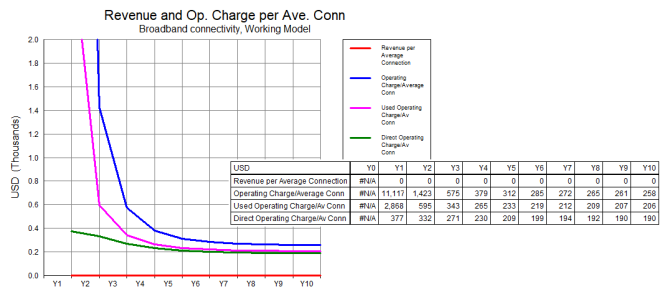
Figure 46: The allocated cost per customer is an essential reference point for tariffing
It is clear from these results that the operator will need to earn, from each customer,
at least USD 300 per annum, just to cover its annual costs once established.
Obviously, there is no revenue yet! Our next step will be to set a tariff.
The other used and direct-charge results on the graph include costs only for resource
capacity which is actually used, and the latter also only in proportion to the used
capacity of intermediate resource drivers. These results may be used to inform a
notion of ‘efficient pricing’ in competitive markets.
(Beyond the scope of this tutorial.)
 Things that you should have seen and understood
Depreciation and Amortisation, Operating Charge (for resources and services)
Revenue and Op. Charge per Ave. Conn (services only)
Format Axis, Maximum