Watch the video presentation and/or read the full text below
Cumulative cashflow or, more precisely, the discounted cumulative cashflow (DCF,
which factors-in reduced certainty into the future), is an essential metric for
viability. The Net Present Value (NPV) result is
a suitably qualified DCF, over the period modelled, plus some measure of terminal
value (a similarly discounted projection into the future).
The Discount Rate is actually a model input, but
we will just use the 10% default. There are also various ways of calculating a terminal
value. (Beyond the scope of this tutorial.)
We will focus on the most cautious result which disregards any terminal value:
-
Select Draw… from the
Graphs menu. The Draw
dialog is displayed.
-
This time, select (Network) as the element.
This unique element represents the aggregate of all service revenues and
resource costs.
-
Draw the graph NPV, which includes
the single result NPV (Zero Terminal Value).
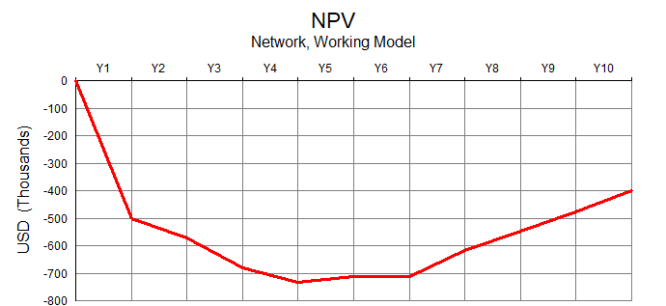
Figure 49: Initial investment is certain, whereas revenue is delayed and cumulatively
discounted
It may be surprising to see that, even though the business is profitable for the
last five years (and indeed cashflow-positive in the same time-frame), it is nowhere
near payback at the end of the period. However, there is significant spending on
initial infrastructure which is unavoidable, whereas the revenue only picks up as
customers are added, and is cumulatively discounted over time, reflecting increasing
risk in the assumptions.
The business is still repaying its investors with no reliable return in sight after
ten years, and this will never be acceptable. 30% profitability is good, or at least
OK, but this must be achieved earlier for the investment to be attractive. With
the cost side as a given, the business must charge more for the service.
Considering the potential trade-off between charging either more
at the start to cover costs vs less to stimulate initial
customer take-up, we will stick to a constant tariff to keep things simple and avoid
compound effects for now. On the strength of the current results, let’s try
doubling the tariff and see if that yields a more favourable outcome:
-
Set Rental Tariff = 60.0 in
the Editor. (There is no need to close the Tariffs
dialog, or any of the other data dialogs, between model runs; the inputs update immediately.)
-
Run the model. The Results program is activated, and the graphs are updated.
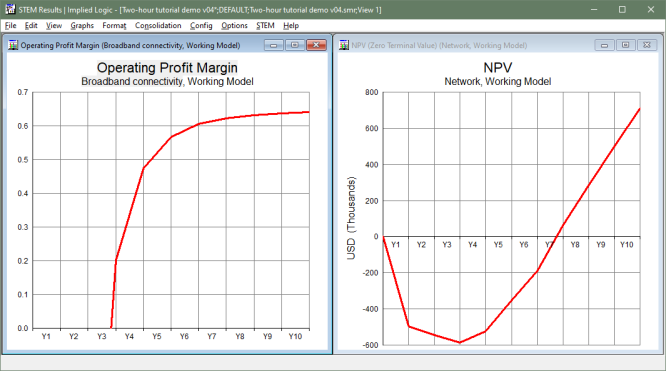
Figure 50: The business now achieves payback, but at what risk?
As you should see reflected in your own results, the business is now profitable
in Y3, and achieves payback by the end of Y7. This is much better, but it’s
‘still too long’ by modern standards, where customer expectations change
every decade because of innovation.
 Things that you should have seen and understood
(Network) element, NPV (Zero Terminal Value), Discount Rate