Watch the video presentation and/or read the full text below
We have just seen that USD 300 per customer is ‘sufficient’ annual revenue
to cover costs, but only actually from Y6 onwards. Instead, we will aim for USD
360, as a ‘round multiple of 12’, corresponding to a monthly tariff
of USD 30:
-
Access the Tariffs dialog
from the icon menu for the service.
-
Enter the Rental Tariff and
Tariff Period inputs as shown below
(directly analogous to the
Rental Cost and
Cost Period we used for the
Space resource).
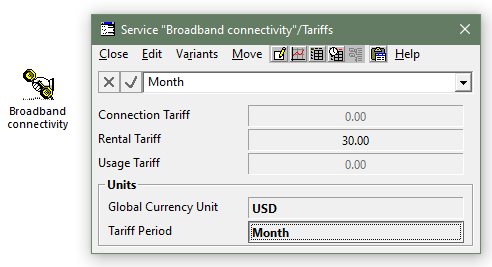
Figure 47: Rental Tariff and
Tariff Period service inputs, comparable to
Rental Cost and
Cost Period for
Space
-
Run the model. The Results program is activated.
-
Now the Revenue per Average Connection
result comes to life, flat at USD 360 as expected,
and exceeds the fully-allocated cost per customer from Y5 onwards.
-
Draw the graphs Operating Profit and
Operating Profit Margin for the service. (You
can make a multiple selection in the Graphs tab
of the Draw Similar dialog.) The latter is very
negative in Y1, so we will amend the scale again.
-
Set Minimum = 0 in the
Format Value Axis dialog (for the value axis)
and click OK. The graph is redrawn with the
negative values suppressed.
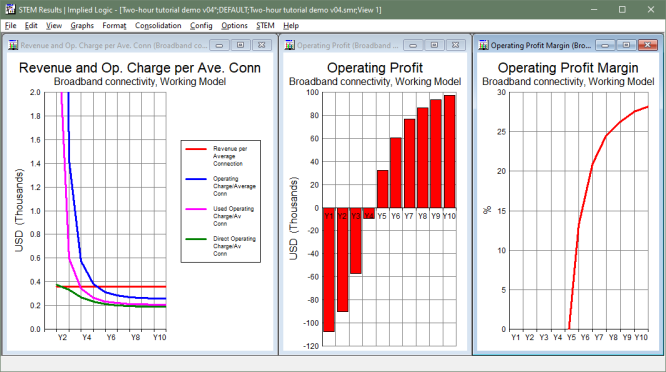
Figure 48: Revenue per Average Connection exceeds
the fully-allocated cost per customer from Y5 onwards
The service is evidently profitable from the end of Y5, increasing from 14% to 28%
over the next five years, but is that enough for a convincing business case?
 Things that you should have seen and understood
Rental Tariff, Tariff Period
Operating Profit, Operating Profit Margin
Format Axis, Minimum