Watch the video presentation and/or read the full text below
Now we are going to examine the essential results for the
Optical interface resource,
applying techniques we learned earlier for drawing graphs:
-
Run the model again. (You can just press <F5> in the Editor.)
There should no longer be any warnings at this stage, and the Results program is
activated directly.
-
Draw the graph Installed Units for the resource
Optical interface the same way that we drew the
first graph for the service earlier. The numbers should be the same as the
Connections result for the service.
-
Use the Draw Similar technique to draw the
additional graphs Capital Expenditure and
Operating Costs. The latter should match the shape
of the Installed Units graph, as an annual maintenance
cost of USD 25 will arise from each installed unit, and this is the only opex item
we have defined so far. As the installed base approaches 1000, the total annual
opex at this stage should approach USD 25 000.
-
Tile the graphs again before proceeding.
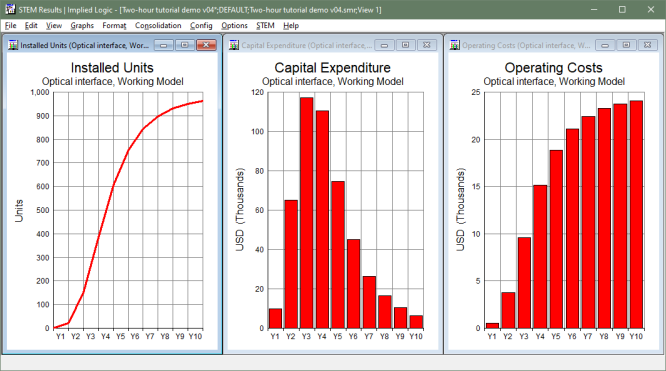
Figure 17: Installation and cost results for the
Optical interfaceresource
But what about the Capital Expenditure graph? What
drives the shape of this graph? We will take this opportunity to learn another useful
technique:
-
Right-click the background of the
Installed Units graph and select
Change Selections… from the
context menu. The Draw dialog is displayed again,
with the current element and graph selections for this graph.
-
Go straight to the Graphs tab, select
Installed and Incremental Units, and press
OK. The graph is redrawn showing both results. Evidently,
the red line reflects the total, while the blue one indicates how many units are
added in a given year; i.e., the ‘delta’. You should see that the
Capital Expenditure graph matches the shape of the
blue line, and that the magnitude is scaled by the specified USD 500 per unit. It
is also easy to verify that the total capex over the ten years amounts to almost
USD 500 000.
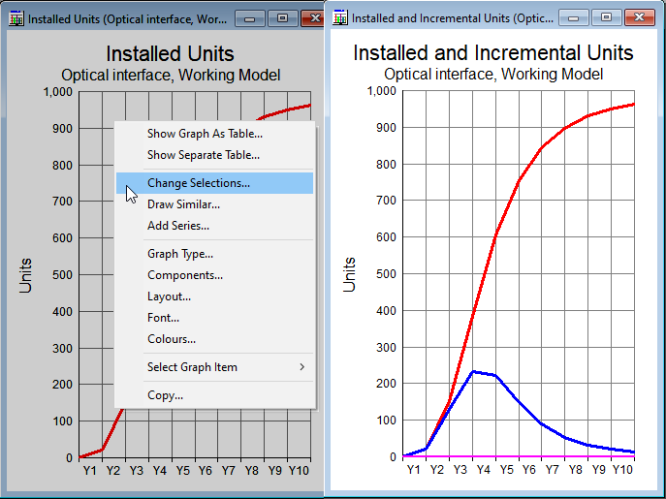
Figure 18: Using the Change Selections command
to alter the current graph
Note: the Change Selections command is very similar to Draw Similar, except that
it alters the current graph, rather than cloning it.
 Things that you should have seen and understood
Change Selections
Installed Units, Capital Expenditure, Operating Costs, Installed and Incremental Units