Watch the video presentation and/or read the full text below
We are going to draw another graph, one which is possibly the most helpful in assessing
whether the installed base is actually realistic:
-
Use the Draw Similar command to draw the
Capacities graph for the
Access card. The graph shows three results:
Installed Capacity,
Used Capacity, and
Slack Capacity.
-
Draw a separate table to examine the numbers. The
Used Capacity simply reflects
the number of customers, while the
Installed Capacity appears to
be just this number rounded up to the nearest multiple of 16. The
Slack Capacity confirms that there
are always fewer than 16 slack ports. Is that realistic? Where are these
ports located?
-
Let’s also draw the graph
Utilisation Ratio for the same resource.
You should see that the apparent deployment is highly (and suspiciously) efficient!
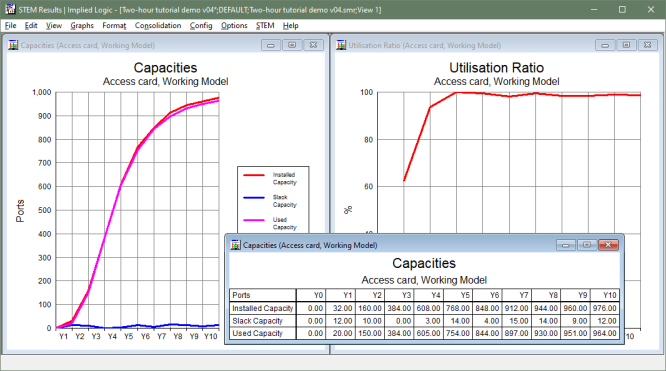
Figure 23: Capacities and
Utilisation Ratio graphs for the
Access card
A common response to these results is to say that an engineer would always provision
‘a few extra ports’ as contingency for imminent additions. Indeed, there
are options which support this approach in the Capacity and
Lifetime dialog (see below) in the context of an individual site. However,
even without such a provisioning strategy, there is a more fundamental reality about
where capacity is required. The plan is to offer service in the vicinity of 25 separate
sites, and so capacity must be provided at each site.
As soon as a first customer presents at a given site, a first unit is required at
that site (or it might be deployed there as part of an initial deployment prior
to launch). Once there are many customers, it is unrealistic to expect these to
be coordinated in multiples of 16 at each site. At any point in time, the required
installation will leave something in the range of 0–15 slack ports
at each site (i.e., up to 375 slack ports in total).
The current results reflect what you would expect for a single-site business.
We need to make STEM aware of the number of sites, and what this means for the
Access card resource.
Note: press <F1> in the Capacity and Lifetime dialog to access the help for
the Maximum Utilisation and Minimum Slack Capacity options. (Beyond the scope of
this tutorial.)
 Things that you should have seen and understood
Capacities: Installed Capacity, Used Capacity, Slack Capacity
Utilisation ratio