Now we are going to see how the calculated WiMAX access bandwidth translates into installation of the WiMAX radio network, starting with the WiMAX radio interface, installed in sectors.
Return to the original model again. Please close the results, switch back to the Editor, close WiMAX-DSL11 and re-open WiMAX-DSL02.
 Save the model as WiMAX-DSL12
- Look at the Capacity and Lifetime inputs for WiMAX access sector and note that we have given it a capacity of 30Mbit/s.
 Save and run the model
- Draw the Capacities graph for WiMAX access sector.
Why is there so much slack capacity to start with? (You may have noticed the Location element, Site Coverage Plan.)
Why is there a gradual installation of capacity during 2006, before the service is launched?
- Switch back to the Editor and select Advanced/Other Details from the icon menu for WiMAX access sector.
- Look for the Planned Units input, just after the Pre-Run Installation section.
- Press <Enter> (or click the small button) and review the interpolated series.
We have modelled a gradual roll-out in advance of service launch.
- Go back to the Capacity and Lifetime dialog and change the Maximum Utilisation input to 0.8.
- Re-run the model and note the impact on the Capacities graph.
Why would you factor this 80% into your network planning?
Resource Unit Utilisation
- Draw the graph Unit Utilisation for WiMAX access sector (remember – using the Draw Similar option will save you time!). It should look something like this:
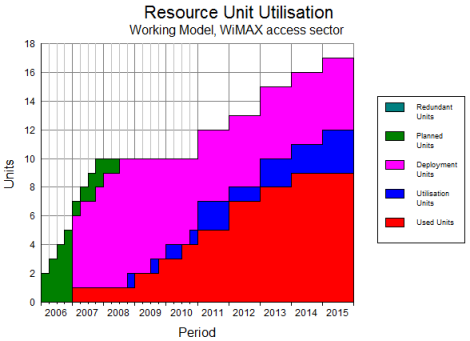
Can you explain these results?
 Things that you should have seen and understood
Planned Units, Maximum Utilisation
Resource Unit Utilisation