The DSL access service in our model has a unique requirement for the DSL shelf resource. In this simple configuration, STEM will replace ageing units of the equipment like-for-like at the end of their physical lifetime. However, this effect is not immediately apparent because the physical lifetime is initially defined as ten years, longer than the scope of the business case defined by the run period. We will try increasing this.
 Save the model as WiMAX-DSL23
Run period and physical lifetime
- Press <F5> to run the working model.
- Draw the pre-defined graph entitled Resource Installed and Incremental Units for the DSL shelf resource.
- Try extending the run period to twenty years to see the subsequent replacement (Data menu/Run Period).
- Set the run period back to ten years and set Physical Lifetime = 5 for the DSL shelf resource (icon menu/Capacity and Lifetime).
In both cases, you should have seen the three shelves, initially installed in 2007, 2008 and 2010, replaced ten or five years later.
Suppose instead we wish to replace the DSL shelf with another model with the same function in the network, but perhaps with a better specification, lower capex per port, or lower opex. It need not have the same capacity.
- Click the
 button on the toolbar and then click again within the view to create a new Resource. Name it DSL shelf 2.
Alternatively, you may prefer to use drag-and-drop to create a copy of the existing DSL shelf resource – just drag a copy onto the view background.
-
Set the following attributes for the new resource:
Capacity Unit = Ports
Capacity = 400.0
Physical Lifetime = 5
Capital Cost = 6000.0
Maintenance Cost = Capital * 0.05.
We now need to link the DSL access service to this resource, but how will STEM know to treat it as a replacement, rather than an additional requirement?
The Function element is a construct which says that a number of related Resources should be considered functionally equivalent in the network.
- First use the <Ctrl> key to select both the DSL shelf and DSL shelf 2 resources.
- Click the
 button on the toolbar and then click again within the view to create a new Function. Name it DSL shelves.
The pre-selected Resources are linked automatically to this new function, and a shaded block surrounds all three elements.
- Arrange the icons so that the colour block does not overlap any other elements. You may prefer to right-click and hide the red function links which connect the resources to the function.
You can use the connection tool or drag-and-drop to add resources to a function later if you don’t select them beforehand.
- Double-click the blue line (function requirement) which now links the DSL access service to the function. The Mappings dialog is displayed.
- Scroll across to 2011 and then enter the values shown below:
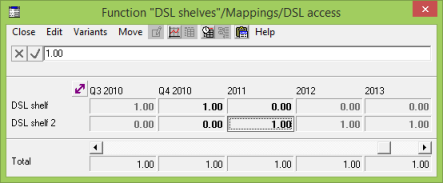
As soon as you enter one value, the underlying type for the row will change from Constant to Interpolated Series. When you enter the second value on a row, STEM will prompt, Adjust surrounding calculated values?.
- Click Yes to this prompt, once for each row.
If you say No, then STEM will first freeze the surrounding cells to keep the surrounding interpolation unchanged. But that is not what we want here!
You can disable this Time-series Prompt from the Options menu, and then STEM will always effect a sweeping change without preserving surround values.
Before you run the model, consider what these Mappings inputs mean. When do you expect STEM to start installing the new resource?
 Save and run the model
If you still have the graph for the original resource, you should immediately see that it is no longer replaced.
- Draw the Resource Installed and Incremental Units graph for the new DSL shelf 2 resource.
When is the first unit installed? How is this working?
- Draw the Resource Capacities graph for both resources. You may find it convenient to tile these four graphs.
- Draw the Function Capacities graph to see the total supported capacity in terms of ports for the DSL access service.
Why do you think there is so much excess capacity in 2011? (You might want to look at the utilisation of the newest shelf in Q4 2010.)
- Draw Resource Utilisation Ratio for both DSL shelf resources on the same graph. This should explain what is going on.
- Save the workspace before proceeding to the next exercise. This will make the same charts visible when we save the model with a new name.

Look at the icon menu for the DSL shelves function in the Editor. You will see that, beyond its own data, it also inherits the menu items from the Resource menu, such as Capacity and Lifetime, Costs and so on. These display tabular dialogs, with one column for each resource, which provide a very convenient way to check inputs for consistency across the function.
If you are modelling a consistent split of demand, e.g., shared between two different types of equipment, then it is safer to use a complementary pair of multiplier transformations than a function, where different lifetimes or capacities may lead to unexpected replacement of one resource by the other.
 Things that you should have seen and understood
Replacement, time-series table
Function, Mapping